i have some reservations about the practicality of reporting likelihood functions and have never done this before, but here are some (sloppy) examples in python. Primarily answering number 1 and 3.
import numpy as np
import pandas as pd
import statsmodels.formula.api as smf
import matplotlib
import pylab
np.random.seed(100)
## Generate some data for a simple case vs control example
# 10 vs 10 replicates with a 1 SD effect size
controls = np.random.normal(size=10)
cases = np.random.normal(size=10) + 1
data = pd.DataFrame(
{
"group": ["control"] * 10 + ["case"] * 10,
"value": np.concatenate((controls, cases)),
}
)
## Perform a standard t-test as comparison
# Using OLS (ordinary least squares) to model the data
results = smf.ols("value ~ group", data=data).fit()
print(f"The p-value is {results.pvalues['group[T.control]']}")
## Report the (log)-likelihood function
# likelihood at the fit value (which is the maximum likelihood)
likelihood = results.llf
# or equivalently
likelihood = results.model.loglike(results.params)
## Results at a range of parameter values:
# we evaluate at 100 points between -2 and 2
control_case_differences = np.linspace(-2, 2, 100)
likelihoods = []
for cc_diff in control_case_differences:
params = results.params.copy()
params["group[T.control]"] = cc_diff
likelihoods.append(results.model.loglike(params))
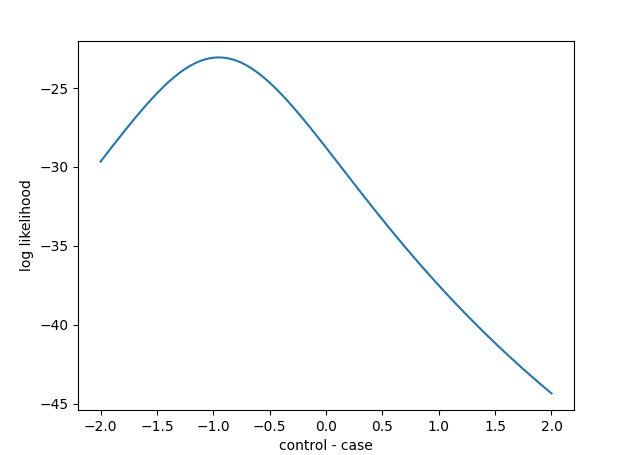
## Plot the likelihood function
fig, ax = pylab.subplots()
ax.plot(
control_case_differences,
likelihoods,
)
ax.set_xlabel("control - case")
ax.set_ylabel("log likelihood")
## Our model actually has two parameters, the intercept and the control-case difference
# We only varied the difference parameter without changing the intercept, which denotes the
# the mean value across both groups (since we are balanced in case/control n's)
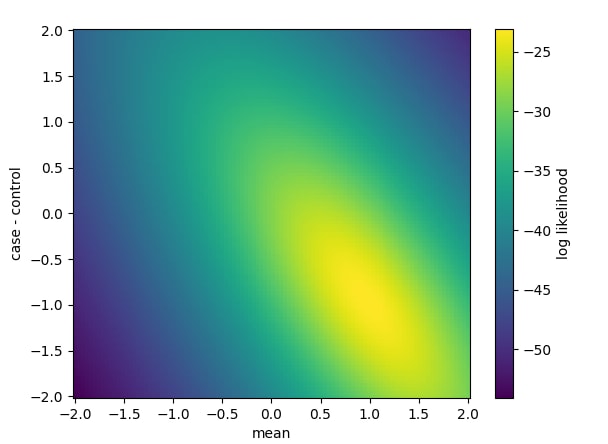
# Now lets vary both parameters, trying all combinations from -2 to 2 in both values
mean_values = np.linspace(-2, 2, 100)
mv, ccd = np.meshgrid(mean_values, control_case_differences)
likelihoods = []
for m, c in zip(mv.flatten(), ccd.flatten()):
likelihoods.append(
results.model.loglike(
pd.Series(
{
"Intercept": m,
"group[T.control": c,
}
)
)
)
likelihoods = np.array(likelihoods).reshape(mv.shape)
# Plot it as a 2d grid
fig, ax = pylab.subplots()
h = ax.pcolormesh(
mean_values,
control_case_differences,
likelihoods,
)
ax.set_ylabel("case - control")
ax.set_xlabel("mean")
fig.colorbar(h, label="log likelihood")The two figures are:
I think this code will extend to any other likelihood-based model in statsmodels, not just OLS, but I haven't tested.
It's also worth familiarizing yourself with how the likelihoods are actually defined. For OLS we assume that residuals are normally distributed. For data points y_i at X_i the likelihood for a linear model with independent, normal residuals is:
where is the parameters of the model, is the variance of the residuals, and is the number of datapoints. So the likelihood function here is this value as a function of (and maybe also , see below).
So if we want to tell someone else our full likelihood function and not just evaluate it at a grid of points, it's enough to tell them and . But that's the entire dataset! To get a smaller set of summary statistics that capture the entire information, you look for 'sufficient statistics'. Generally for OLS those are just and . I think that's also enough to recreate the likelihood function up to a constant?
Note that matters for reporting the likelihood but doesn't matter for traditional frequentist approaches like MLE and OLS since it ends up cancelling out when you're doing finding the maximum or reporting likelihood ratios. This is inconvenient for reporting likelihood functions and I think the code I provided is just using the estimated from the MLE estimate. However, at the end of the day, someone using your likelihood function would really only be using it to extract likelihood ratios and therefore the probably doesn't matter here either?
I just read the article https://arbital.com/p/likelihoods_not_pvalues/, but this left me with one big question: what is the actual sequence of actions a researcher would take to report a likelihood function based on their research? For background, I'm an undergraduate student who has participated in multiple undergraduate research positions, and who has so far been uncertain about how to compute and use likelihood functions based on the data (mostly econometric data) involved in this research.
In particular, I want to find out:
If you have good answers for any of these questions, I'd really like to know.