is not a transpose! It is the timestep . We are raising to the -th power.
Thanks!
Our current best guess is that this includes costs other than the amortized compute of the final training run.
If no extra information surfaces we will add a note clarifying this and/or adjust our estimate.
Thanks Neel!
The difference between tf16 and FP32 comes to a x15 factor IIRC. Though also ML developers seem to prioritise other characteristics than cost effectiveness when choosing GPUs like raw performance and interconnect, so you can't just multiply the top price performance we showcase by this factor and expect that to match the cost performance of the largest ML runs today.
More soon-ish.
This site claims that the strong SolidGoldMagikarp was the username of a moderator involved somehow with Twitch Plays Pokémon
I also found this thread of math topics on AI safety helpful.
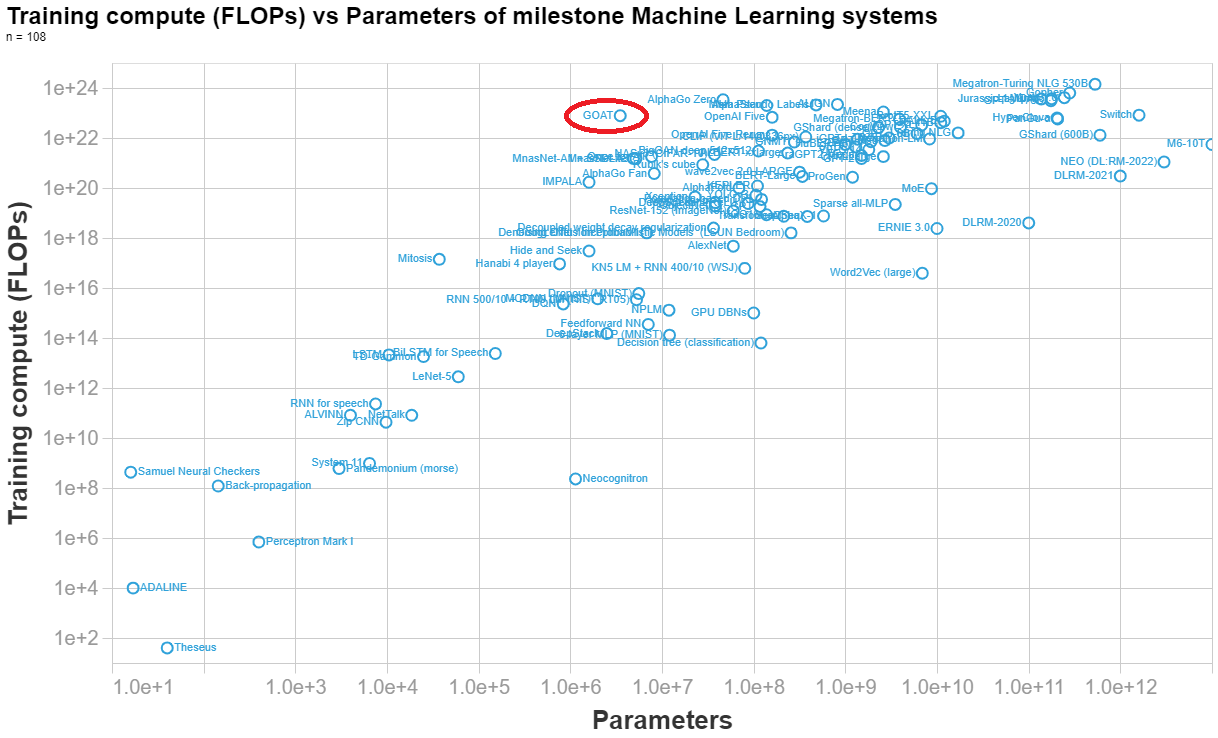
Marius Hobbhahn has estimated the number of parameters here. His final estimate is 3.5e6 parameters.
Anson Ho has estimated the training compute (his reasoning at the end of this answer). His final estimate is 7.8e22 FLOPs.
Below I made a visualization of the parameters vs training compute of n=108 important ML system, so you can see how DeepMind's syste (labelled GOAT in the graph) compares to other systems.

[Final calculation]
(8 TPUs)(4.20e14 FLOP/s)(0.1 utilisation rate)(32 agents)(7.3e6 s/agent) = 7.8e22 FLOPs==========================
NOTES BELOW[Hardware]
- "Each agent is trained using 8 TPUv3s and consumes approximately 50,000 agent steps (observations) per second."
- TPUv3 (half precision): 4.2e14 FLOP/s
- Number of TPUs: 8
- Utilisation rate: 0.1[Timesteps]
- Figure 16 shows steps per generation and agent. In total there are 1.5e10 + 4.0e10 + 2.5e10 + 1.1e11 + 2e11 = 3.9e11 steps per agent.
- 3.9e11 / 5e4 = 8e6 s → ~93 days
- 100 million steps is equivalent to 30 minutes of wall-clock time in our setup. (pg 29, fig 27)
- 1e8 steps → 0.5h
- 3.9e11 steps → 1950h → 7.0e6 s → ~82 days
- Both of these seem like overestimates, because:
“Finally, on the largest timescale (days), generational training iteratively improves population performance by bootstrapping off previous generations, whilst also iteratively updating the validation normalised percentile metric itself.” (pg 16)
- Suggests that the above is an overestimate of the number of days needed, else they would have said (months) or (weeks)?
- Final choice (guesstimate): 85 days = 7.3e6 s[Population size]
- 8 agents? (pg 21) → this is describing the case where they’re not using PBT, so ignore this number
- The original PBT paper uses 32 agents for one task https://arxiv.org/pdf/1711.09846.pdf (in general it uses between 10 and 80)
- (Guesstimate) Average population size: 32
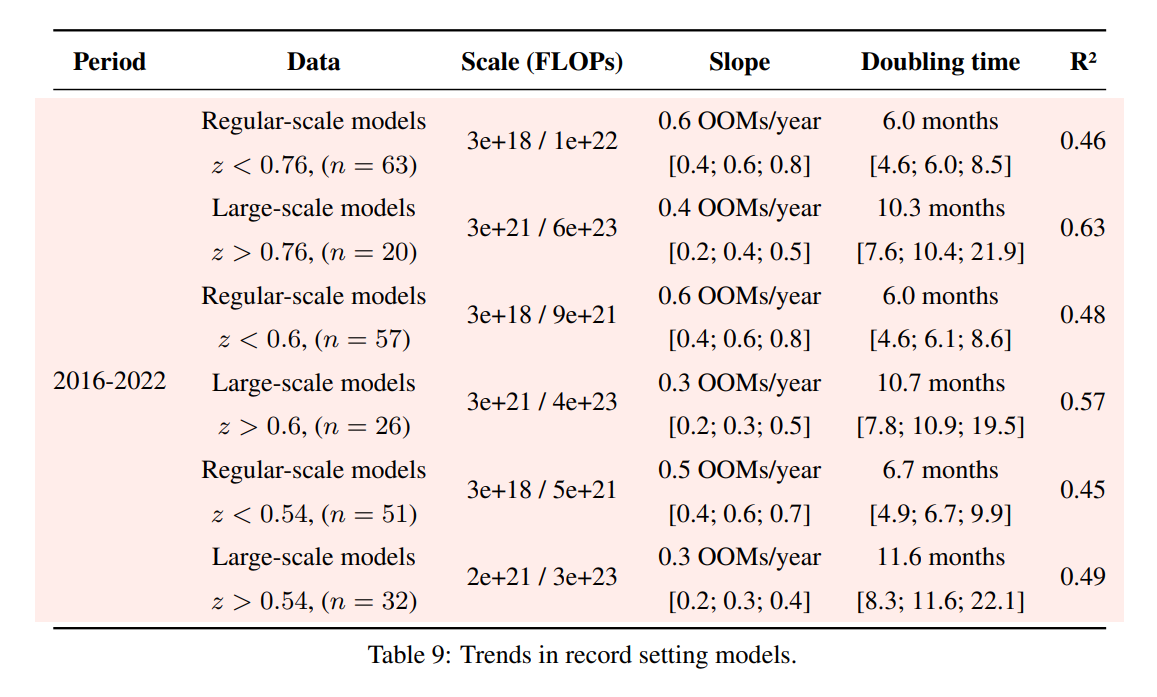
Following up on this: we have updated appendix F of our paper with an analysis of different choices of the threshold that separates large-scale and regular-scale systems. Results are similar independently of the threshold choice.

There's also a lot of research that didn't make your analysis, including work explicitly geared towards smaller models. What exclusion criteria did you use? I feel like if I was to perform the same analysis with a slightly different sample of papers I could come to wildly divergent conclusions.
It is not feasible to do an exhaustive analysis of all milestone models. We necessarily are missing some important ones, either because we are not aware of them, because they did not provide enough information to deduce the training compute or because we haven't gotten to annotate them yet.
Our criteria for inclusion is outlined in appendix A. Essentially it boils down to ML models that have been cited >1000 times, models that have some historical significance and models that have been deployed in an important context (eg something that was deployed as part of Bing search engine would count). For models in the last two years we were more subjective, since there hasn't been enough time for the more relevant work to stand out the test of time.
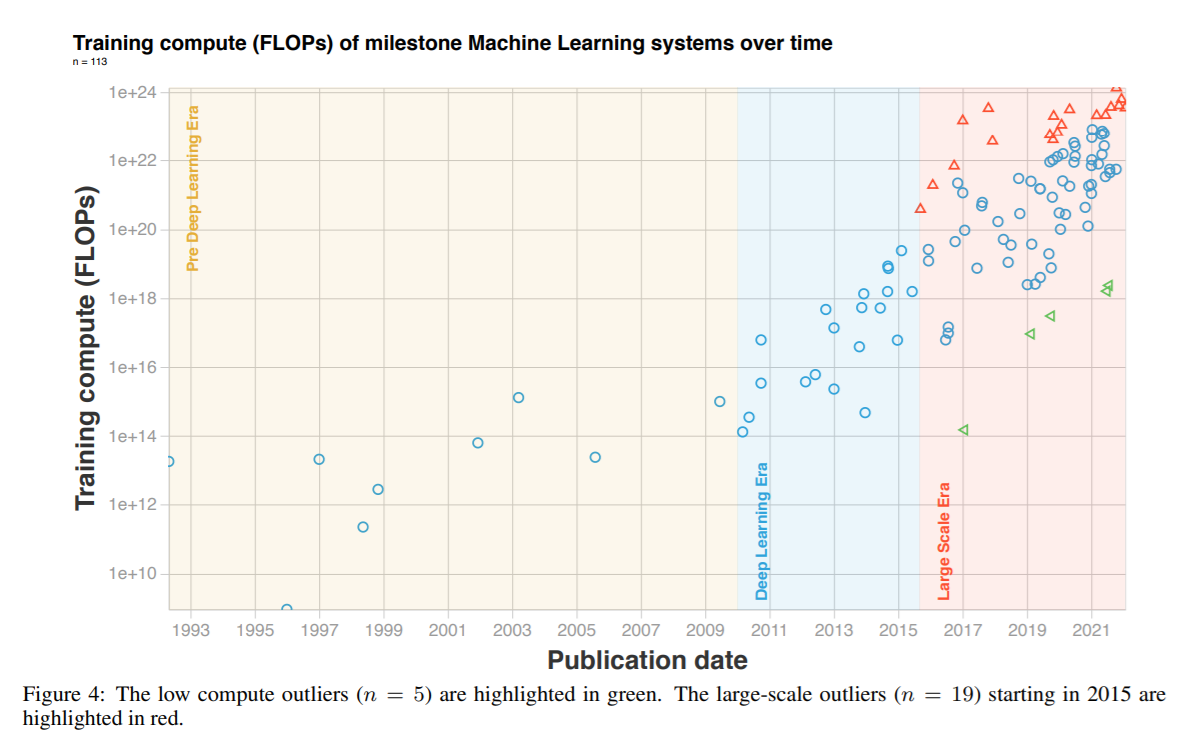
We also excluded 5 models that have abnormally low compute, see figure 4.

We tried playing around with the selection of papers that was excluded and it didn't significantly change our conclusions, though obviously the dataset is biased in many ways. Appendix G discusses the possible biases that may have crept in.
We have conveniently just updated our database if anyone wants to investigate this further!
https://epochai.org/data/notable-ai-models