A bit more than a year ago, I wroteExtrapolating GPT-N performance, trying to predict how fast scaled-up models would improve on a few benchmarks. Google Research just releaseda paper reporting benchmark performance of PaLM: a 540B parameter model trained on 780B tokens. This post contains an updated version of one of the old graphs, where I've added PaLM's performance.
You can read the original post for the full details, but as a quick explainer of how to read the graph:
Each dot represents a particular model’s performance on a particular benchmark (taken from the GPT-3 paper). Color represents benchmark; y-position represents benchmark performance (normalized between random and my guess of maximum possible performance); and the x-position represents loss on GPT-3’s validation set.
The x-axis is also annotated with the required size+data that you’d need to achieve that loss (if you trained to convergence) according to theoriginal scaling laws paper.
(After the point at which OpenAI’s scaling-laws predicts that you’d only have to train on each data point once, it is also annotated with the amount of FLOP you’d need to train on each data point once.)
The crosses represent Google’s new language model, PaLM. Since they do not report loss, I infer what position it should have from the size and amount of data it was trained on. (The relationship between parameters and data is very similar to what OpenAI's scaling laws recommended.)
The sigmoid lines are only fit to the GPT-3 dots, not the PaLM crosses.
Some reflections:
SuperGLUE is above trend (and happens to appear on the Cloze & completion trendline — this is totally accidental). ANLI sees impressive gains, though nothing too surprising given ~sigmoidal scaling.
Common sense reasoning + Reading tasks are right on trend.
Cloze & completion, Winograd, and Q&A are below trend.
The average is amusingly right-on-trend, though I wouldn’t put a lot of weight on that, given that the weighting of the different benchmarks is totally arbitrary.
(The current set-up gives equal weight to everything — despite e.g. SuperGLUE being a much more robust benchmark than Winograd.)
And a few caveats:
The GPT-3 paper was published 2 years ago. I would’ve expected some algorithmic progress by now — and the PaLM authors claim to have made some improvements. Accounting for that, this looks more like it’s below-trend.
The graph also relies on a number of other hunches, like what counts as maximum performance for each benchmark. And using sigmoids in particular was never that well-motivated.
Since GPT-3 was developed, people have created much harder benchmarks, like MMLU and Big-bench. I expect these to be more informative than the ones in the graph above, since there’s a limit on how much information you can get from benchmarks that are already almost solved.
On the graph, it looks like the difference between GPT-3 (the rightmost dots) and PaLM is a lot bigger than the difference between GPT-3 and the previous dot. However, the log-distance in compute is actually bigger between the latter than between the former. The reason for this discrepancy is that GPT-3 slightly underperformed the scaling laws, and therefore appears relatively more towards the left than you would have expected from the compute invested in it.
You calculated things for the neural network brain size anchor; now here's the peformance scaling trend calculation (I think):
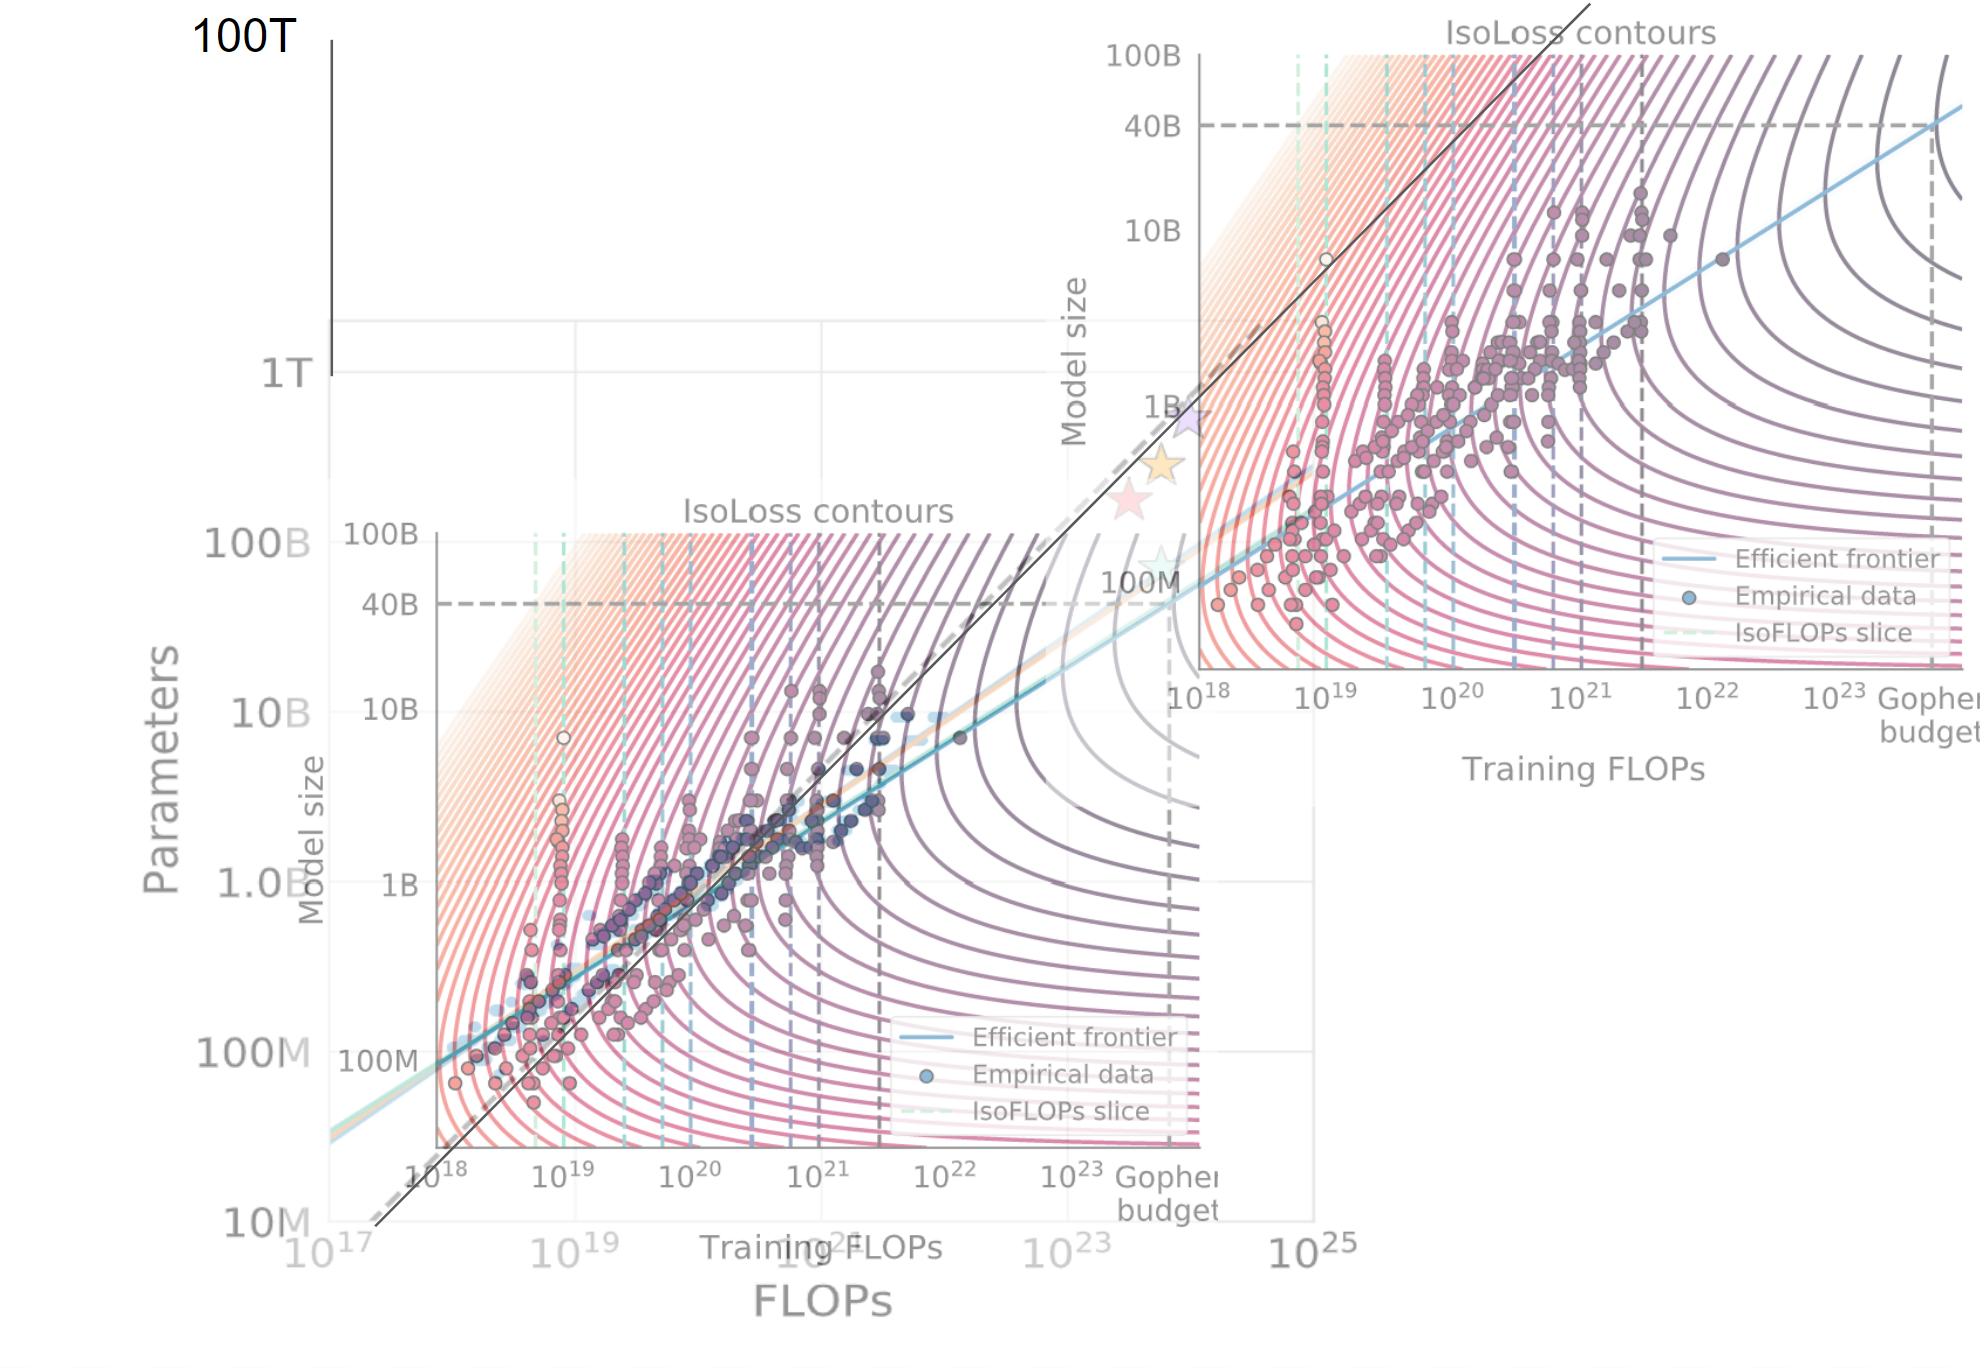
I took these graphs from the Chinchilla paper and then made them transparent and superimposed them on one another and then made a copy on the right to extend the line. And I drew some other lines to extend them.
Eyeballing this graph it looks like whatever performance we could achieve with 10^27 FLOPs under the Kaplan scaling laws, we can now achieve with 10^25 FLOPs. (!!!) This is a big deal if true. Am I reasoning incorrectly here?
If this is anywhere close to correct, then the distinction you mention between two methods of getting timelines -- "Assume it happens when we train a brain-sized model compute-optimally" vs. "assume it happens when we get to superhuman performance on this ensemble of benchmarks that we already have GPT trends for" becomes even more exciting and important than I thought! It's like, a huge huge crux, because it basically makes for a 4 OOM difference!
EDIT: To be clear, if this is true then I think I should update away from the second method, on the grounds that it predicts we are only about 1 OOM away and that seems implausible.
A bit more than a year ago, I wrote Extrapolating GPT-N performance, trying to predict how fast scaled-up models would improve on a few benchmarks. Google Research just released a paper reporting benchmark performance of PaLM: a 540B parameter model trained on 780B tokens. This post contains an updated version of one of the old graphs, where I've added PaLM's performance.
(Edit: I've made a further update here.)
You can read the original post for the full details, but as a quick explainer of how to read the graph:
Some reflections:
And a few caveats: