12 Answers sorted by
130
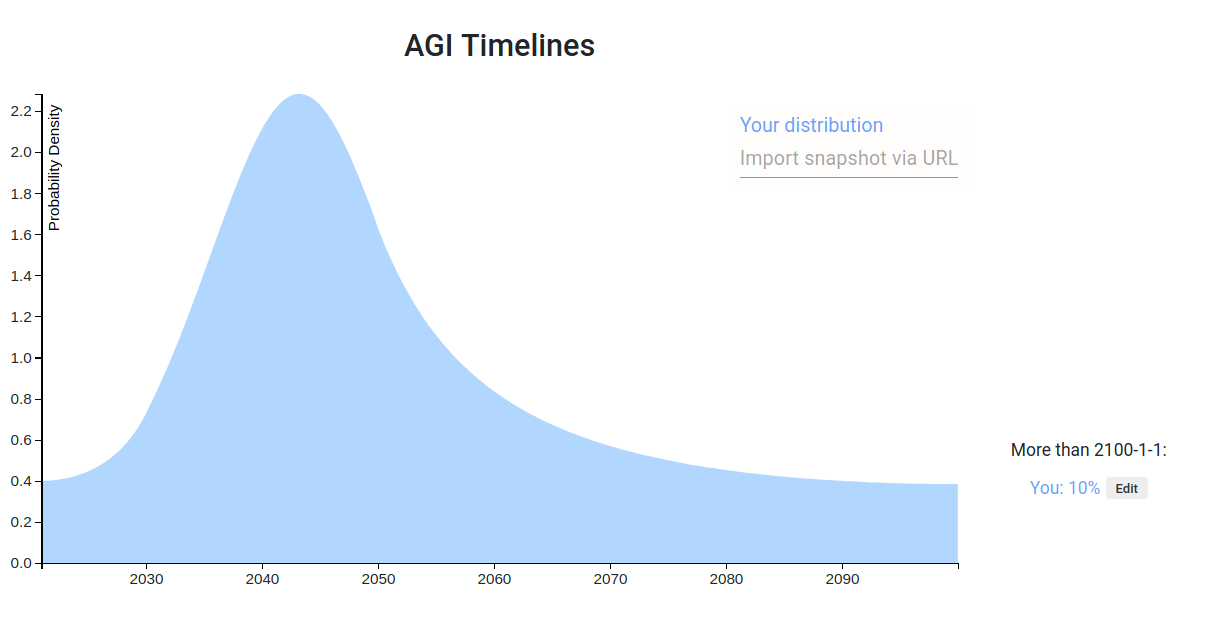
A week ago I recorded a prediction on AI timeline after reading a Vox article on GPT-3 . In general I'm much more spread out in time than the Lesswrong community. Also, I weigh more heavily outside view considerations than detailed inside view information. For example, a main consideration of my prediction is using the heurastic With 50% probability, things will last twice as long as they already have, with the starting time of 1956, the time of the Dartmouth College summer AI conference.
If AGI will definitely happen eventually, then the heuristic gives us [21.3, 64, 192] years at the [25th, 50th, 75th] percentiles of AGI to occur. AGI may never happen, but the chance of that is small enough that adjusting for that here will not make a big difference (I put ~10% that AGI will not happen for 500 years or more, but it already matches that distribution quite well).
A more inside view consideration is: what happens if the current machine learning paradigm scales to AGI? Given that assumption, a 50% confidence interval might be [2028, 2045] (since the current burst of machine learning research began in 2012-2013), which is more in line with the Lesswrong predictions and Metaculus community prediction . Taking the super outside view consideration and the outside view-ish consideration together, I get the prediction I made a week ago.
I adapted my prediction to the timeline of this post [1], and compared it with some other commenters predictions [2].
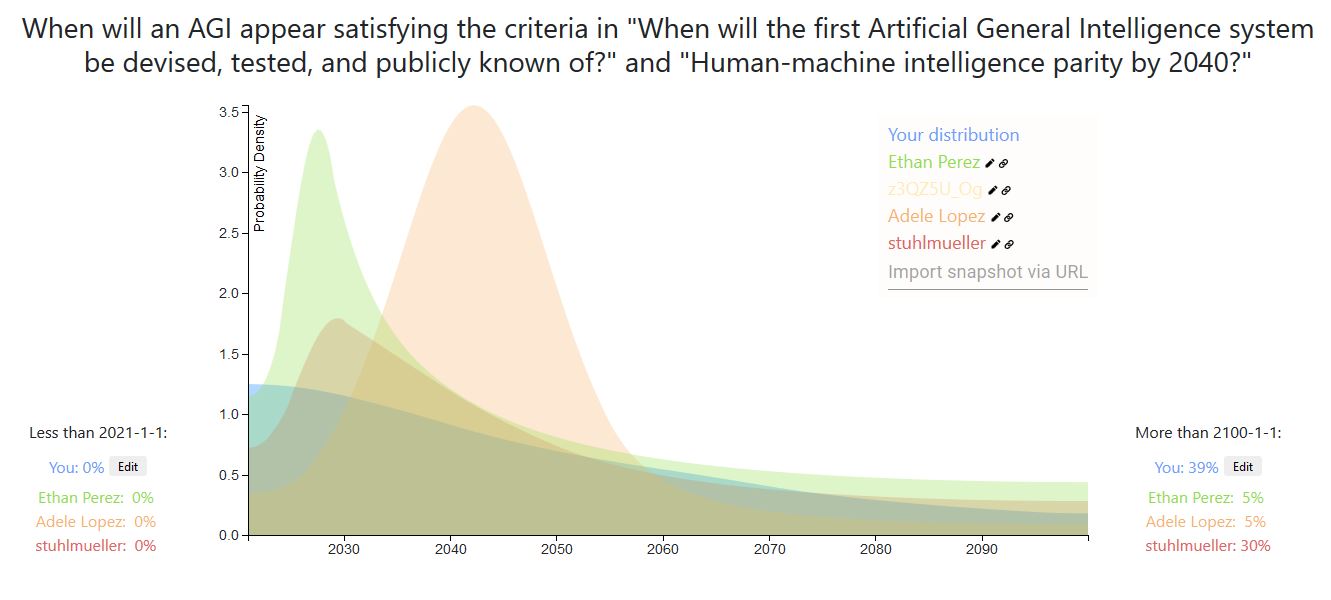
For example, a main consideration of my prediction is using the heurastic With 50% probability, things will last twice as long as they already have, with the starting time of 1956, the time of the Dartmouth College summer AI conference.
A counter hypothesis I’ve heard (not original to me) is: With 50% probability, we will be half-way through the AI researcher-years required to get AGI.
I think this suggests much shorter timelines, as most researchers have been doing research in the last ~10 years.
It's not clear to me what reference class makes sense here though. Like, I feel like 50% doesn’t make any sense. It implies that for all outstanding AI problems we’re fifty percent there. We’re 50% of the way to a rat brain, to a human emulation, to a vastly superintelligent AGI, etc. It’s not a clearly natural category for a field to be “done”, and it’s not clear which thing counts as ”done” in this particular field.
I was looking at the NIPS growth numbers last June and I made a joke:
AI researcher anthropics: 'researchers [should] tend to think AI is ~20 years away because given exponential growth of researchers & careers of ~30 years, the final generation of researchers will make up a majority of all researchers, hence, by SSA+Outside View, one must assume 20 years.'
(Of course, I'm making a rather carbon-chauvinistic assumption here that it's only human researchers/researcher-years which matter.)
*
160Here is my snapshot. My reasoning is basically similar to Ethan Perez', it's just that I think that if transformative AI is achievable in the next five orders of magnitude of compute improvement (e.g. prosaic AGI?), it will likely be achieved in the next five years or so. I also am slightly more confident that it is, and slightly less confident that TAI will ever be achieved.
I am aware that my timelines are shorter than most... Either I'm wrong and I'll look foolish, or I'm right and we're doomed. Sucks to be me.
[Edited the snapshot slightly on 8/23/2020]
[Edited to add the following powerpoint slide that gets a bit more at my reasoning]
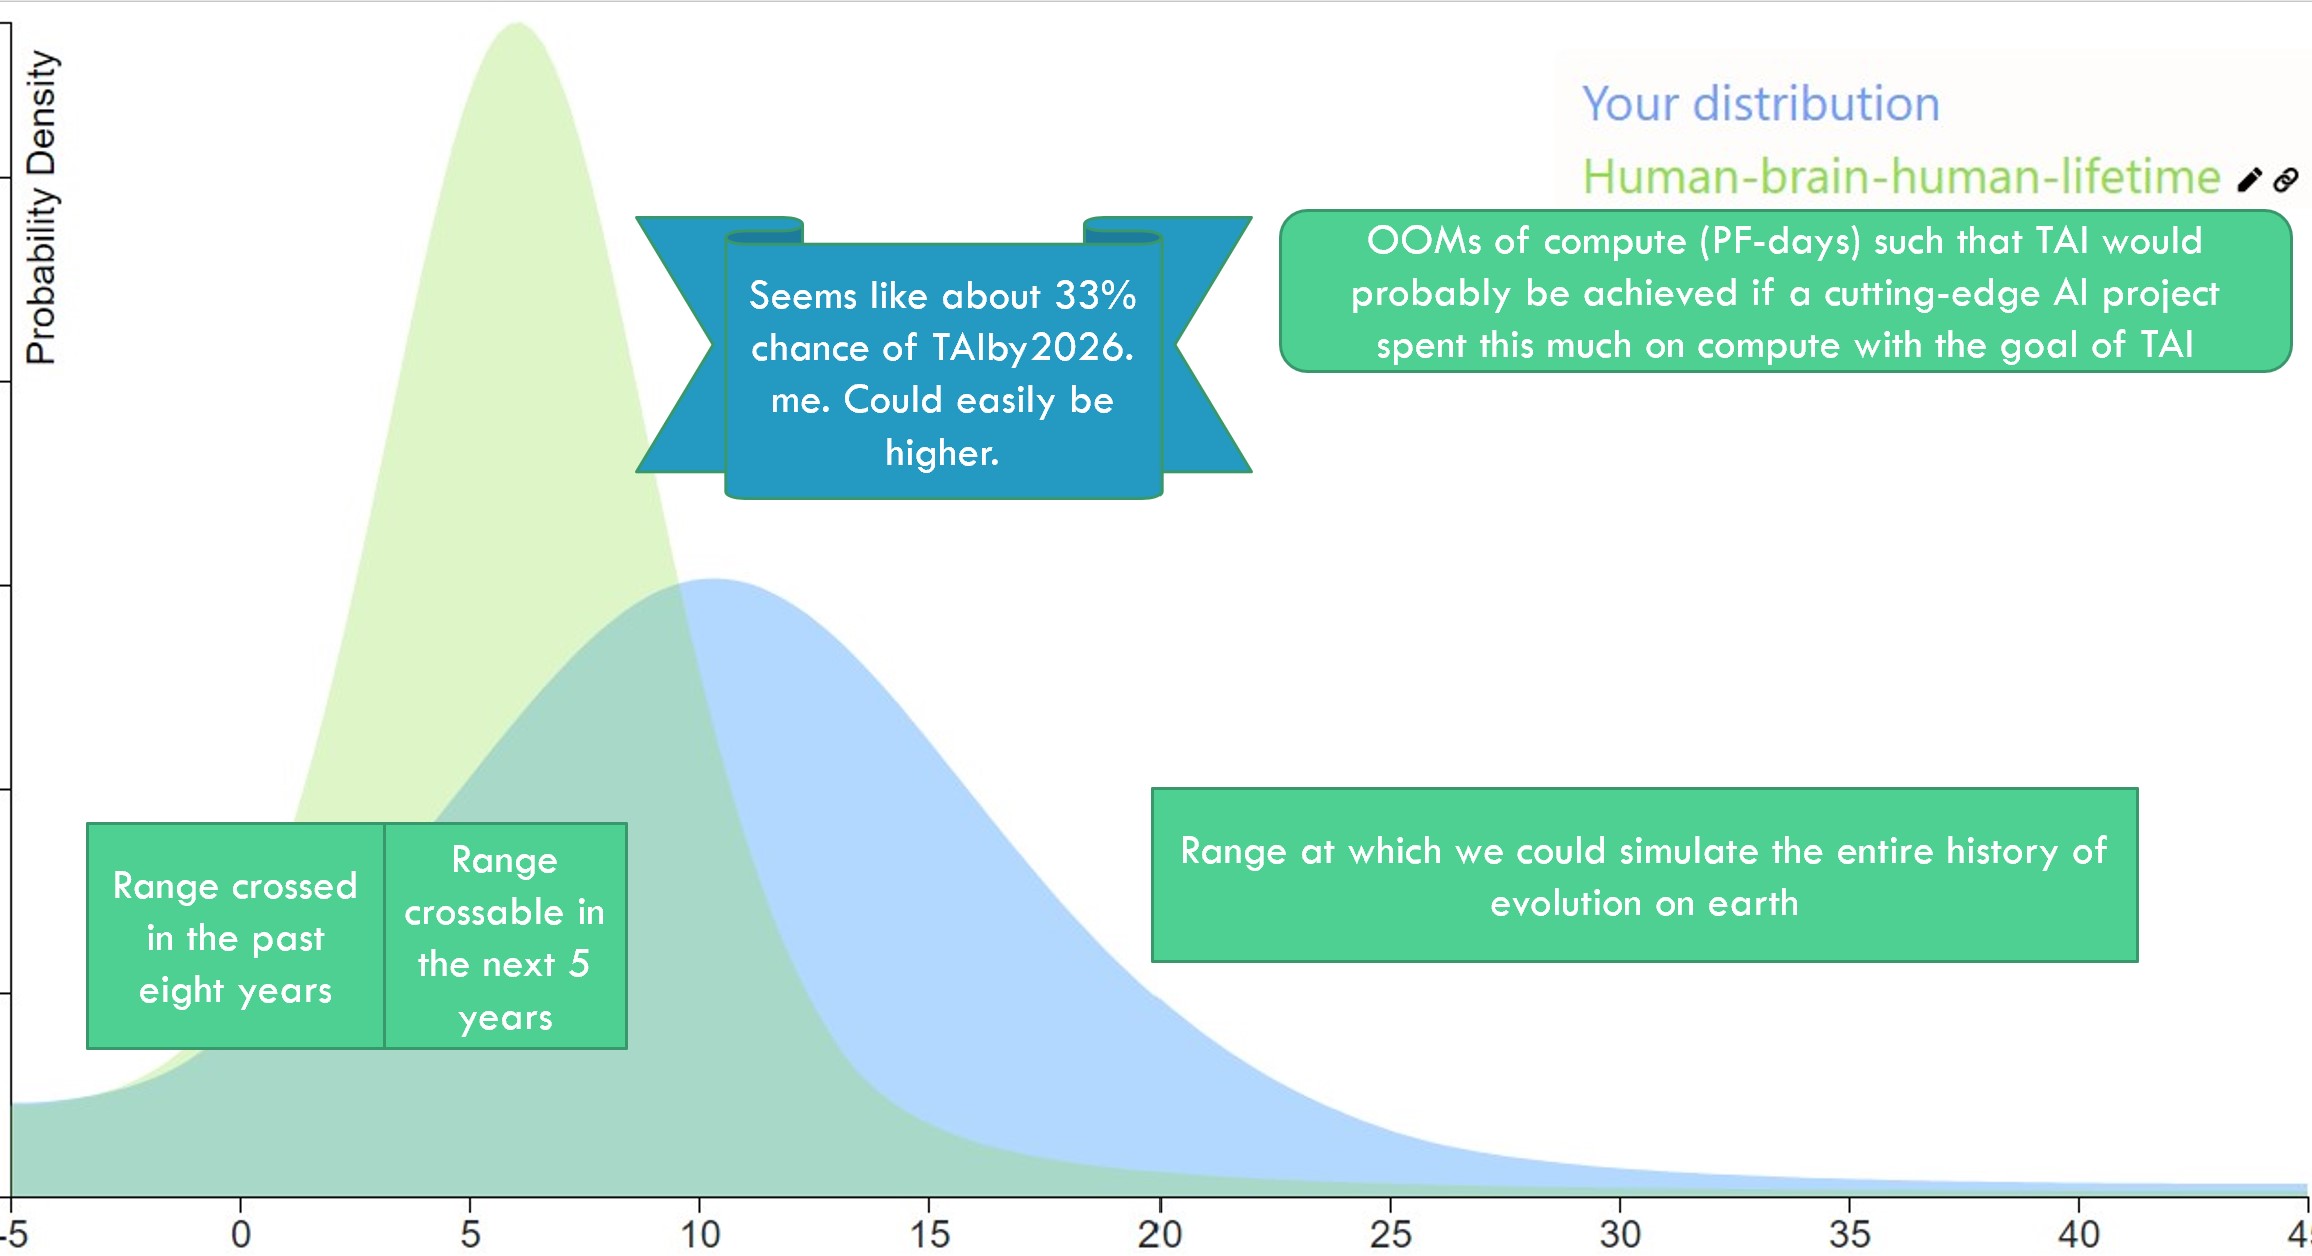
Blast from the past!
I'm biased but I'm thinking this "33% by 2026" forecast is looking pretty good.
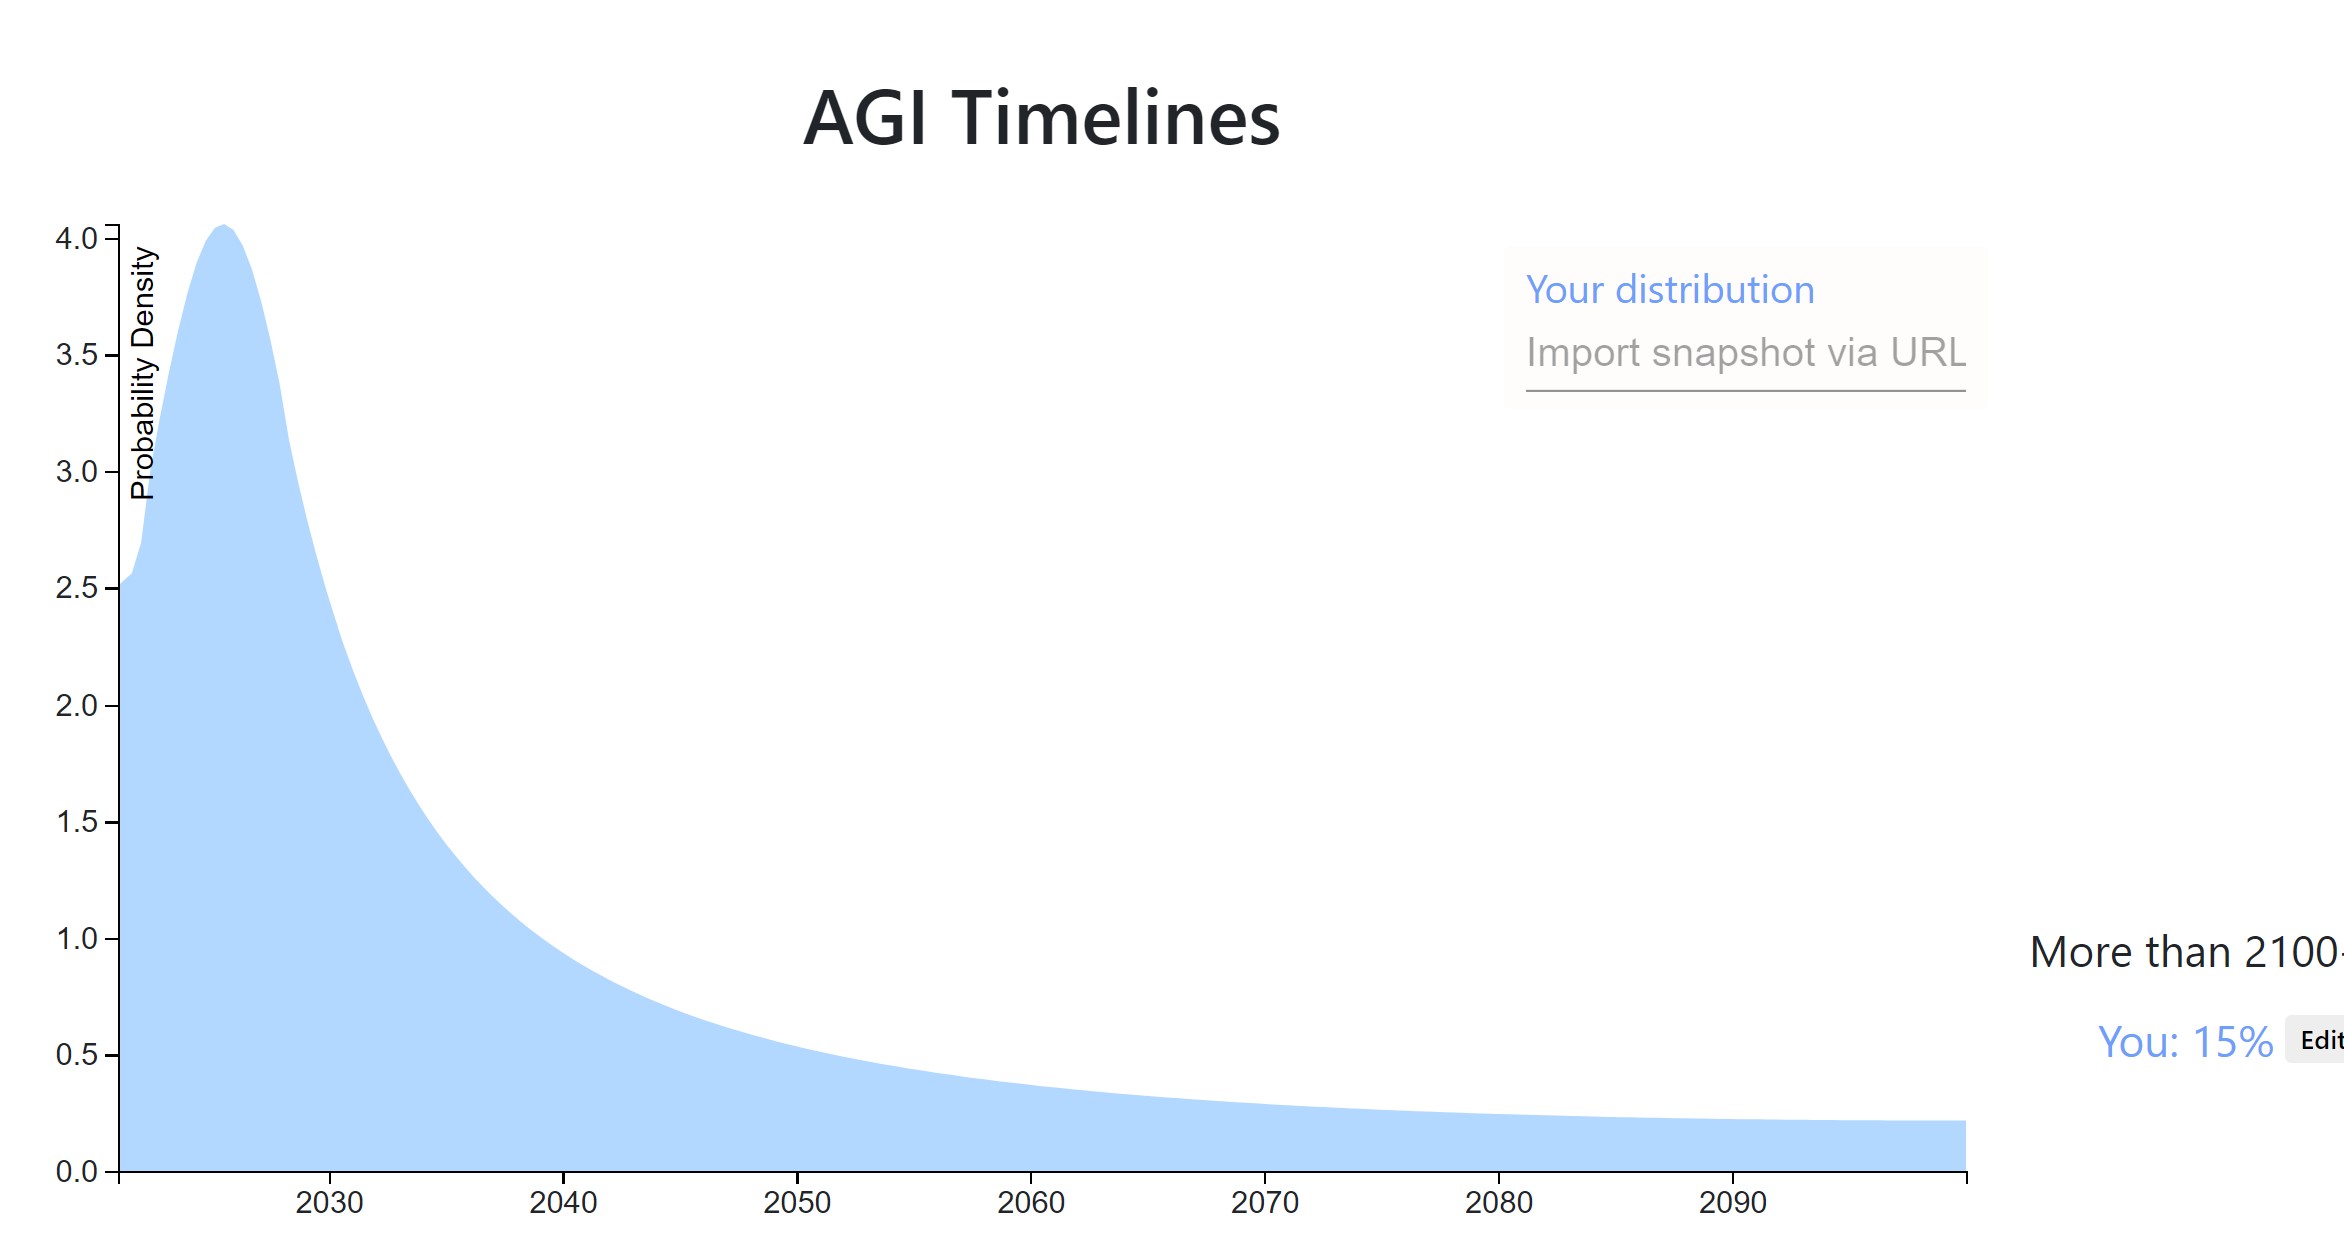
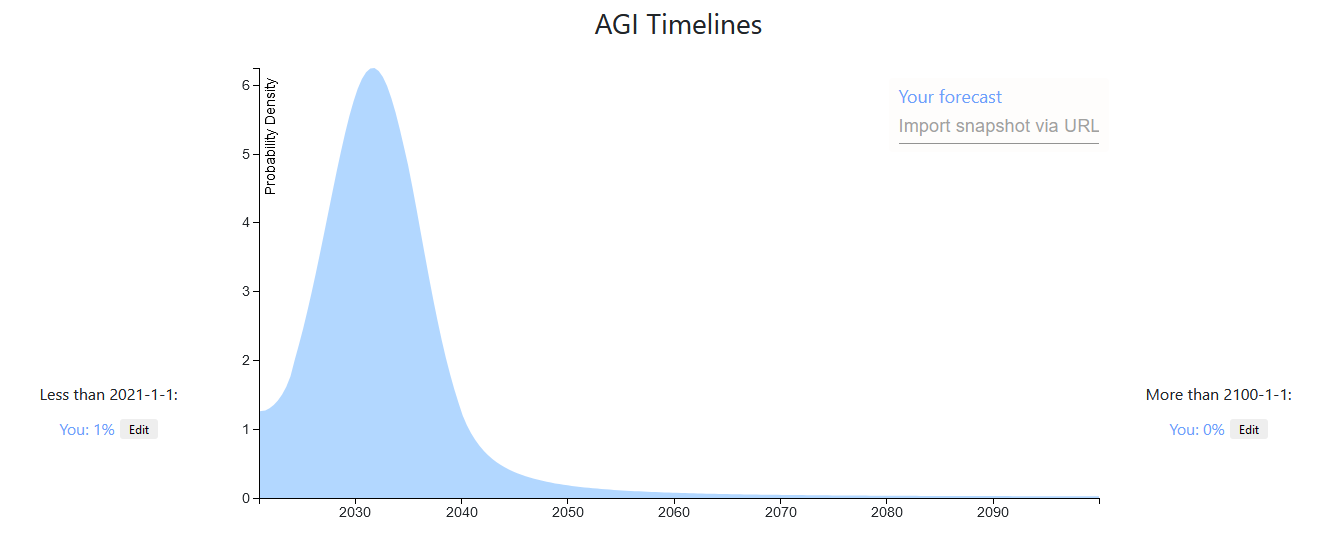
It's been a year, what do my timelines look like now?
My median has shifted to the left a bit, it's now 2030. However, I have somewhat less probability in the 2020-2025 range I think, because I've become more aware of the difficulties in scaling up compute. You can't just spend more money. You have to do lots of software engineering and for 4+ OOMs you literally need to build more chip fabs to produce more chips. (Also because 2020 has passed without TAI/AGI/etc., so obviously I won't put as much mass there...)
So if I were to draw a distribution it would look pretty similar, just a bit more extreme of a spike and the tip of the spike might be a bit to the right.
*
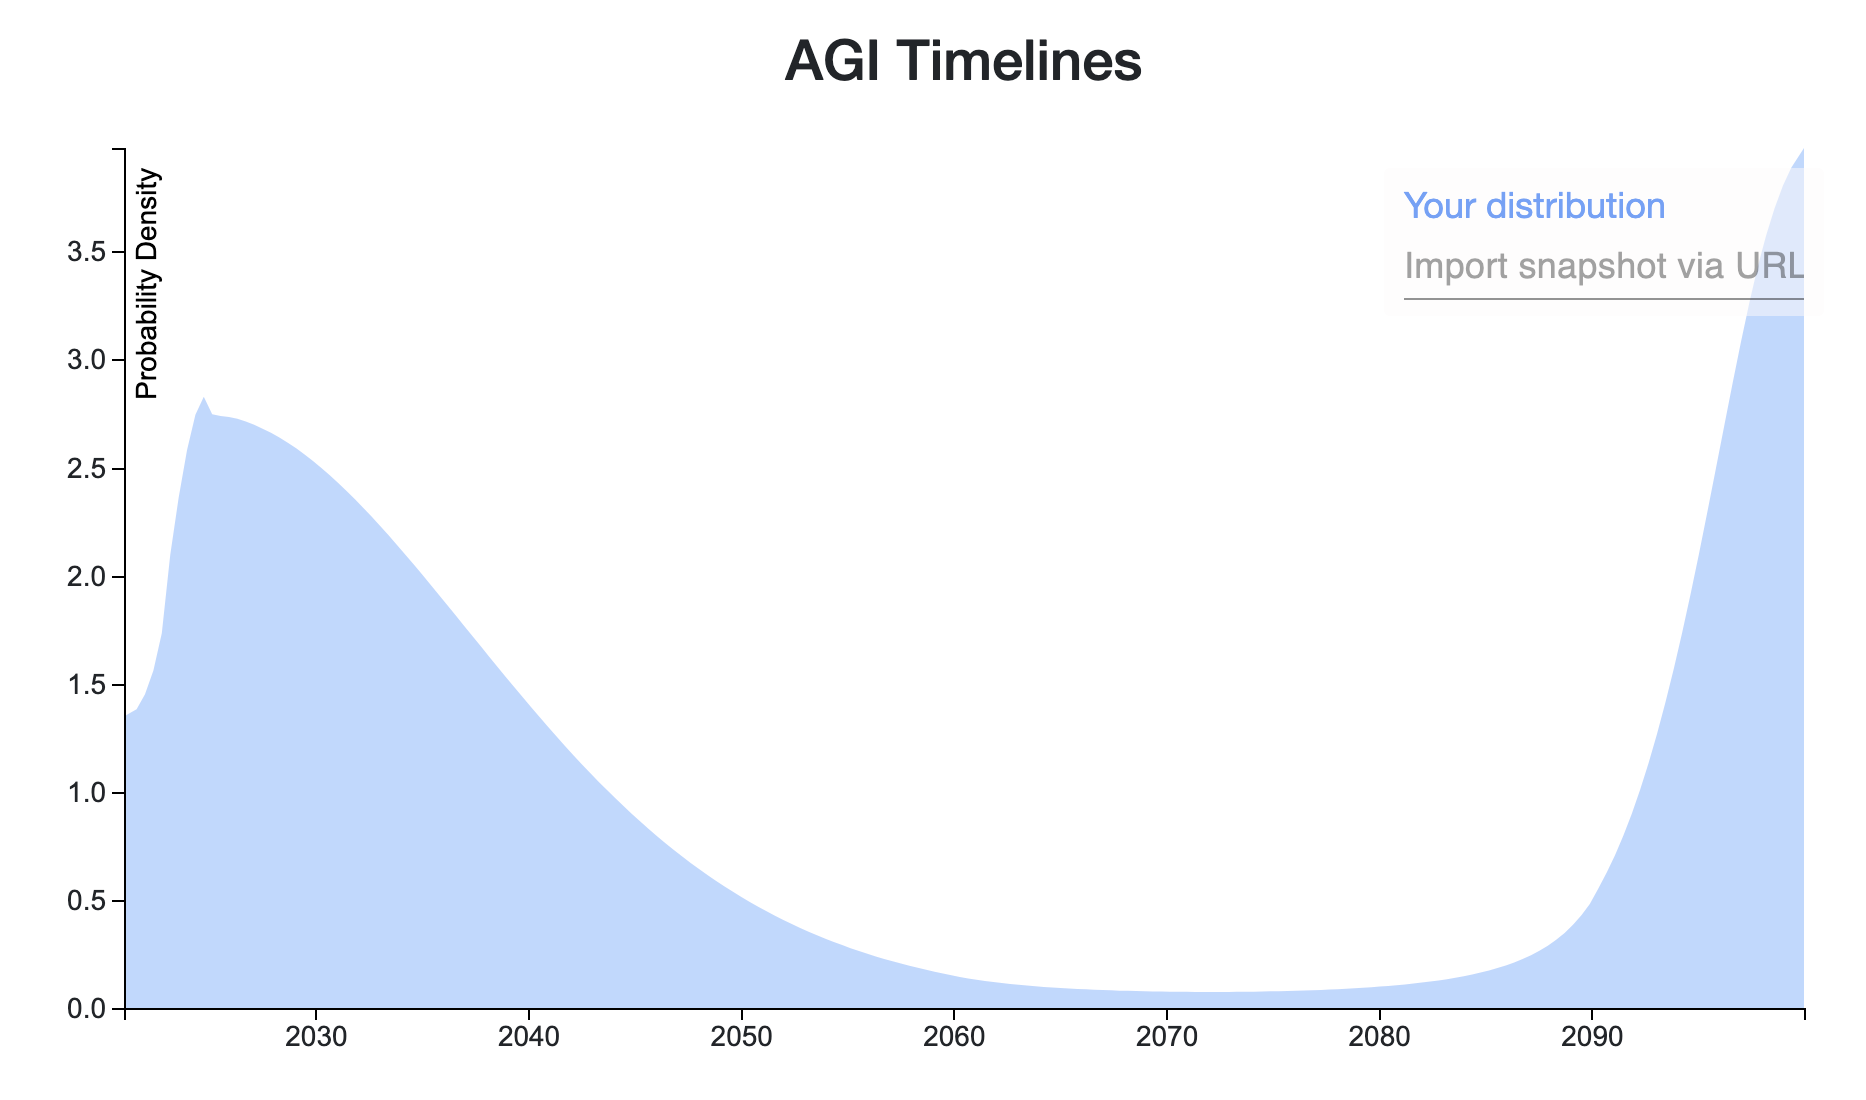
150Here is my Elicit Snapshot.
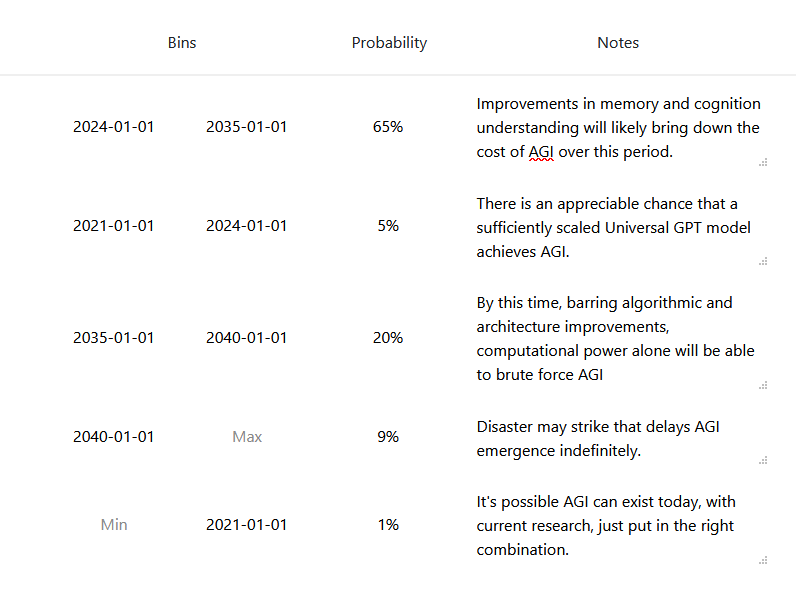
I'll follow the definition of AGI given in this Metaculus challenge, which roughly amounts to a single model that can "see, talk, act, and reason." My predicted distribution is a weighted sum of two component distributions described below:
- Prosaic AGI (25% probability). Timeline: 2024-2037 (Median: 2029): We develop AGI by scaling and combining existing techniques. The most probable paths I can foresee loosely involves 3 stages: (1) developing a language model with human-level language ability, then (2) giving it visual capabilities (i.e., talk about pictures and videos, solve SAT math problems with figures), and then (3) giving it capabilities to intelligently act in the world (i.e., trade stocks or navigate webpages). Below are my timelines for the above stages:
- Human-level Language Model: 1.5-4.5 years (Median: 2.5 years). We can predictably improve our language models by increasing model size (parameter count), which we can do in the following two ways:
- Scaling Language Model Size by 1000x relative to GPT3. 1000x is pretty feasible, but we'll hit difficult hardware/communication bandwidth constraints beyond 1000x as I understand.
- Increasing Effective Parameter Count by 100x using modeling tricks (Mixture of Experts, Sparse Tranformers, etc.)
- +Visual Capabilities: 2-6 extra years (Median: 4 years). We'll need good representation learning techniques for learning from visual input (which I think we mostly have). We'll also need to combine vision and language models, but there are many existing techniques for combining vision and language models to try here, and they generally work pretty well. A main potential bottleneck time-wise is that the language+vision components will likely need to be pretrained together, which slows the iteration time and reduces the number of research groups that can contribute (especially for learning from video, which is expensive). For reference, Language+Image pretrained models like ViLBERT came out 10 months after BERT did.
- +Action Capabilities: 0-6 extra years (Median: 2 years). GPT3-style zero-shot or few-shot instruction following is the most feasible/promising approach to me here; this approach could work as soon as we have a strong, pretrained vision+language model. Alternatively, we could use that model within a larger system, e.g. a policy trained with reinforcement learning, but this approach could take a while to get to work.
- Human-level Language Model: 1.5-4.5 years (Median: 2.5 years). We can predictably improve our language models by increasing model size (parameter count), which we can do in the following two ways:
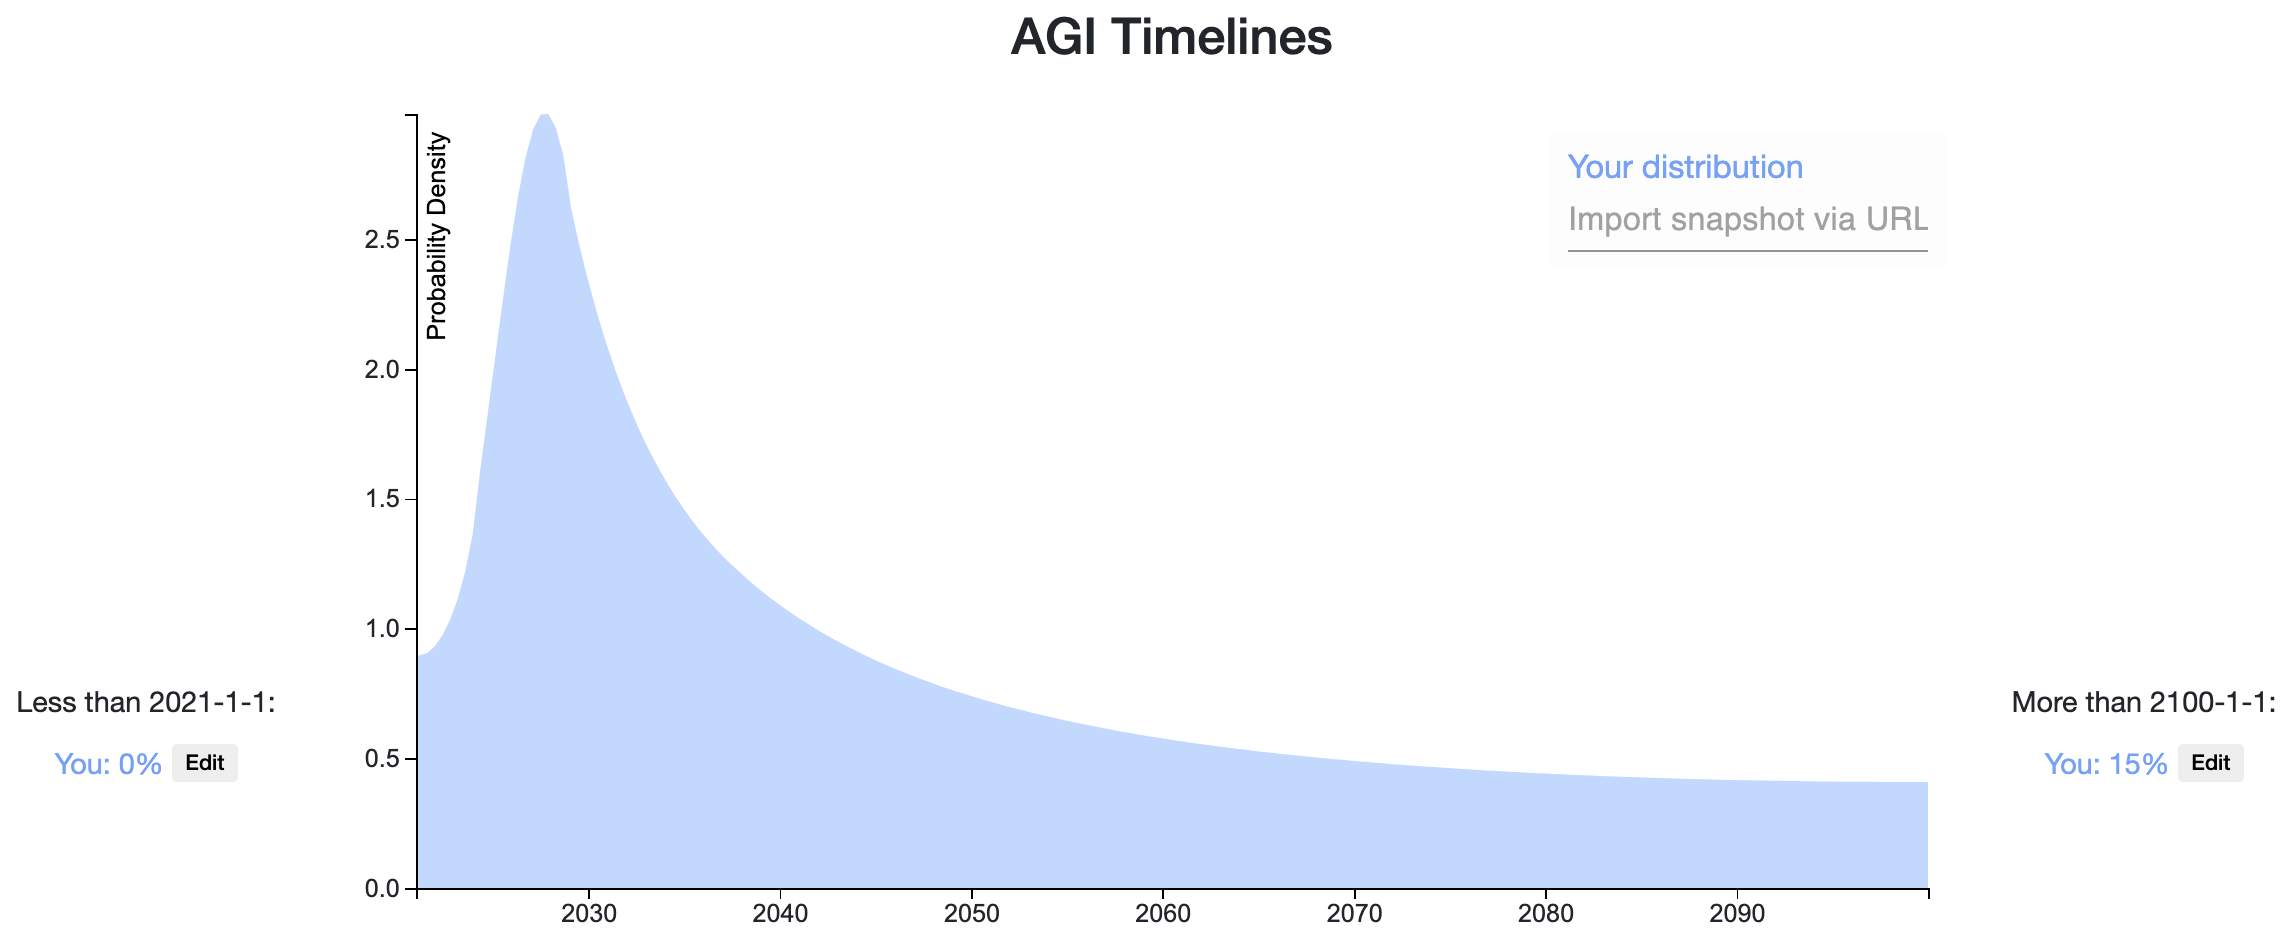
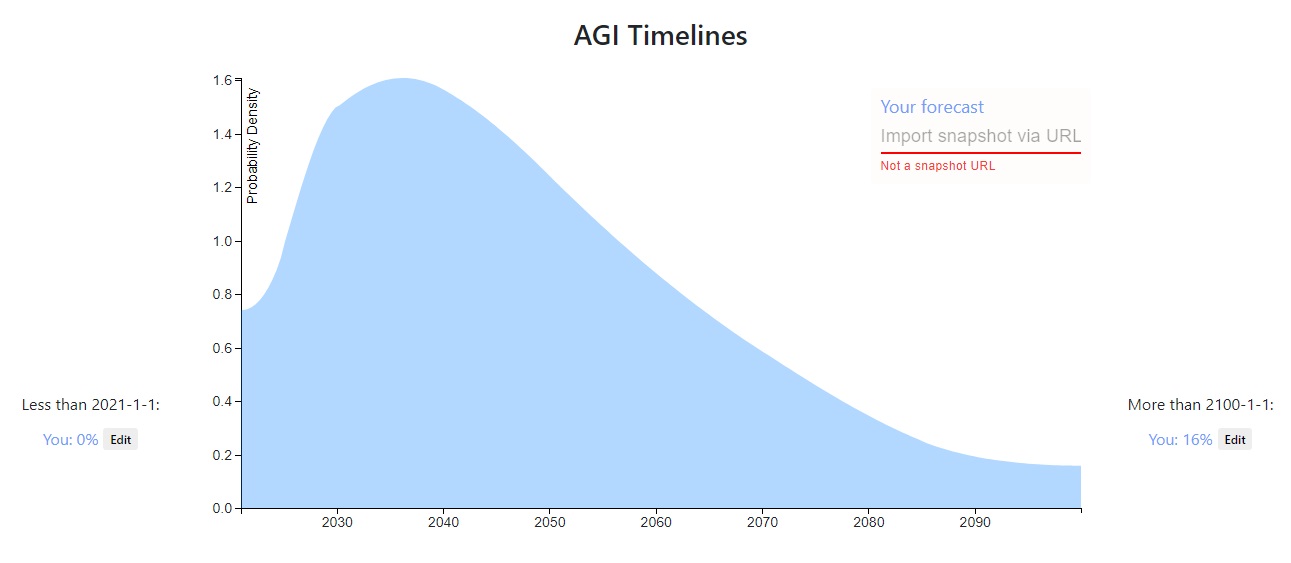
- Breakthrough AGI (75% probability). Timeline: Uniform probability over the next century: We need several, fundamental breakthroughs to achieve AGI. Breakthroughs are hard to predict, so I'll assume a uniform distribution that we'll hit upon the necessary breakthroughs at any year <2100, with 15% total probability mass after 2100 (a rough estimate); I'm estimating 15% roughly based on a 5% probability that we won't find the right insights by 2100, 5% probability that we have the right insights but not enough compute by 2100, and 5% probability to account for planning fallacy, unknown unknowns, and the fact that a number of top AI researchers believe that we are very far from AGI.
My probability for Prosaic AGI is based on an estimated probability of each of the 3 stages of development working (described above):
P(Prosaic AGI) = P(Stage 1) x P(Stage 2) x P(Stage 3) = 3/4 x 2/3 x 1/2 = 1/4
------------------
Updates/Clarification after some feedback from Adam Gleave:
- Updated from 5% -> 15% probability that AGI won't happen by 2100 (see reasoning above). I've updated my Elicit snapshot appropriately.
- There are other concrete paths to AGI, but I consider these fairly low probability to work first (<5%) and experimental enough that it's hard to predict when they will work. For example, I can't think of a good way to predict when we'll get AGI from training agents in a simulated, multi-agent environment (e.g., in the style of OpenAI's Emergent Tool Use paper). Thus, I think it's reasonable to group such other paths to AGI into the "Breakthrough AGI" category and model these paths with a uniform distribution.
- I think you can do better than a uniform distribution for the "Breakthrough AGI" category, by incorporating the following information:
- Breakthroughs will be less frequent as time goes on, as the low-hanging fruit/insights are picked first. Adam suggested an exponential decay over time / Laplacian prior, which sounds reasonable.
- Growth of AI research community: Estimate the size of the AI research community at various points in time, and estimate the pace of research progress given that community size. It seems reasonable to assume that the pace of progress will increase logarithmically in the size of the research community, but I can also see arguments for why we'd benefit more or less from a larger community (or even have slower progress).
- Growth of funding/compute for AI research: As AI becomes increasingly monetizable, there will be more incentives for companies and governments to support AI research, e.g., in terms of growing industry labs, offering grants to academic labs to support researchers, and funding compute resources - each of these will speed up AI development.
90
Here's my answer. I'm pretty uncertain compared to some of the others!

First, I'm assuming that by AGI we mean an agent-like entity that can do the things associated with general intelligence, including things like planning towards a goal and carrying that out. If we end up in a CAIS-like world where there is some AI service or other that can do most economically useful tasks, but nothing with very broad competence, I count that as never developing AGI.
I've been impressed with GPT-3, and could imagine it or something like it scaling to produce near-human level responses to language prompts in a few years, especially with RL-based extensions.
But, following the list (below) of missing capabilities by Stuart Russell, I still think things like long-term planning would elude GPT-N, so it wouldn't be agentive general intelligence. Even though you might get those behaviours with trivial extensions of GPT-N, I don't think it's very likely.
That's why I think AGI before 2025 is very unlikely (not enough time for anything except scaling up of existing methods). This is also because I tend to expect progress to be continuous, though potentially quite fast, and going from current AI to AGI in less than 5 years requires a very sharp discontinuity.
AGI before 2035 or so happens if systems quite a lot like current deep learning can do the job, but which aren't just trivial extensions of them - this seems reasonable to me on the inside view - e.g. it takes us less than 15 years to take GPT-N and add layers on top of it that handle things like planning and discovering new actions. This is probably my 'inside view' answer.
I put a lot of weight on a tail peaking around 2050 because of how quickly we've advanced up this 'list of breakthroughs needed for general intelligence' -
There is this list of remaining capabilities needed for AGI in an older post I wrote, with the capabilities of 'GPT-6' as I see them underlined:
Stuart Russell’s List
human-like language comprehension
cumulative learning
discovering new action sets
managing its own mental activity
For reference, I’ve included two capabilities we already have that I imagine being on a similar list in 1960
So we'd have discovering new action sets, and managing mental activity - effectively, the things that facilitate long-range complex planning, remaining.
So (very oversimplified) if around the 1980s we had efficient search algorithms, by 2015 we had image recognition (basic perception) and by 2025 we have language comprehension courtesy of GPT-8, that leaves cumulative learning (which could be obtained by advanced RL?), then discovering new action sets and managing mental activity (no idea). It feels a bit odd that we'd breeze past all the remaining milestones in one decade after it took ~6 to get to where we are now. Say progress has sped up to be twice as fast, then it's 3 more decades to go. Add to this the economic evidence from things like Modelling the Human Trajectory, which suggests a roughly similar time period of around 2050.
Finally, I think it's unlikely but not impossible that we never build AGI and instead go for tool AI or CAIS, most likely because we've misunderstood the incentives such that it isn't actually economical or agentive behaviour doesn't arise easily. Then there's the small (few percent) chance of catastrophic or existential disaster which wrecks our ability to invent things. This is the one I'm most unsure about - I put 15% for both but it may well be higher.
This is also because I tend to expect progress to be continuous, though potentially quite fast, and going from current AI to AGI in less than 5 years requires a very sharp discontinuity.
I object! I think your argument from extrapolating when milestones have been crossed is good, but it's just one argument among many. There are other trends which, if extrapolated, get to AGI in less than five years. For example if you extrapolate the AI-compute trend and the GPT-scaling trends you get something like "GPT-5 will appear 3 years from now and be 3 orders of mag...
*
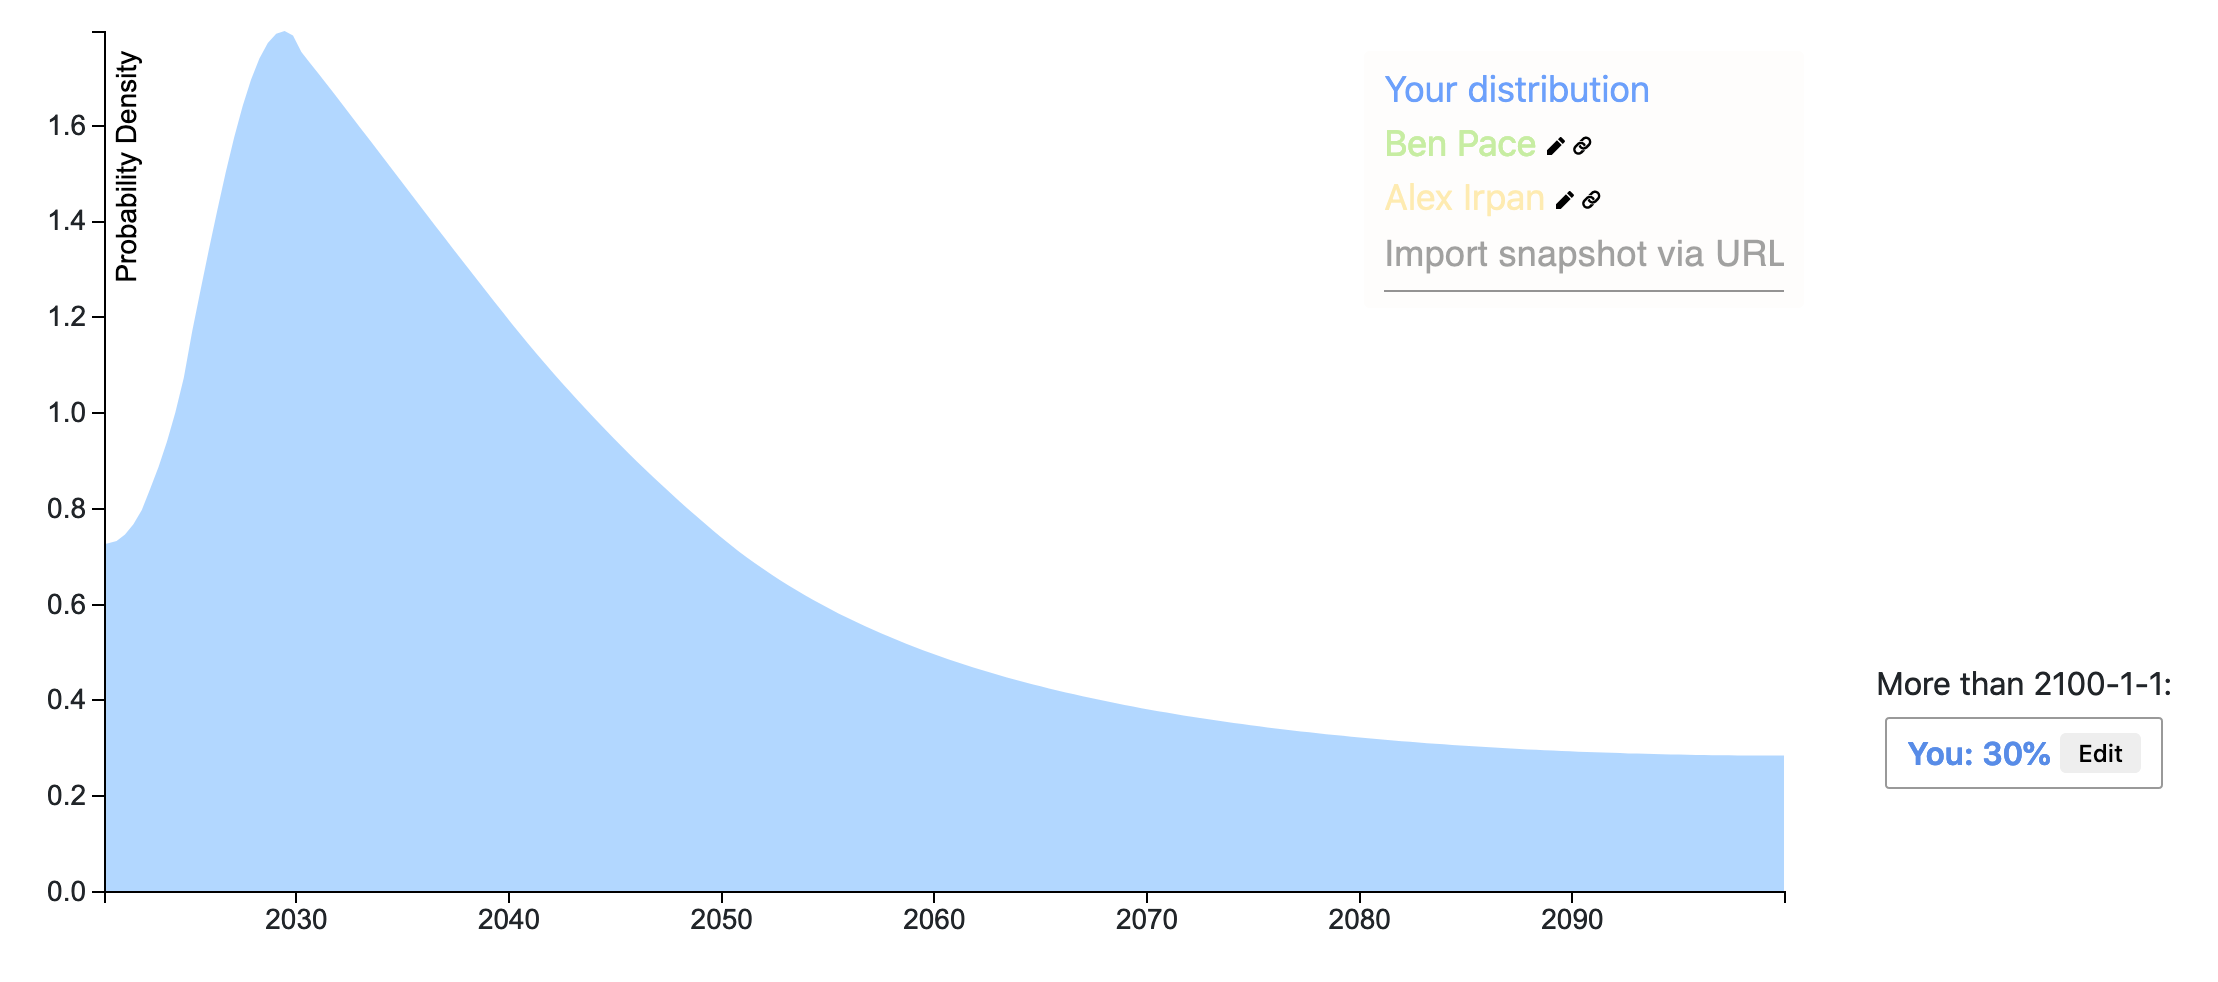
100Here's my quick forecast, to get things going. Probably if anyone asks me questions about it I'll realise I'm embarrassed by it and change it.
It has three buckets:
10%: We get to AGI with the current paradigm relatively quickly without major bumps.
60%: We get to it eventually sometime in the next ~50 years.
30%: We manage to move into a stable state where nobody can unilaterally build an AGI, then we focus on alignment for as long as it takes before we build it.
2nd attempt
Adele Lopez is right that 30% is super optimistic. Also I accidentally put a bunch within '2080-2100', instead of 'after 2100'. And also I thought about it more. here's my new one.
Link.
It has four buckets:
20% Current work leads directly into AI in the next 15 years.
55% There are some major bottlenecks, new insights needed, and some engineering projects comparable in size to the manhattan project. This is 2035 to 2070.
10% This is to fill out 2070 to 2100.
15% We manage to move to a stable state, or alternatively civilizational collapse / non-AI x-risk stops AI research. This is beyond 2100.
90
My rough take: https://elicit.ought.org/builder/oTN0tXrHQ
3 buckets, similar to Ben Pace's
- 5% chance that current techniques just get us all the way there, e.g. something like GPT-6 is basically AGI
- 10% chance AGI doesn't happen this century, e.g. humanity sort of starts taking this seriously and decides we ought to hold off + the problem being technically difficult enough that small groups can't really make AGI themselves
- 50% chance that something like current techniques and some number of new insights gets us to AGI.
If I thought about this for 5 additional hours, I can imagine assigning the following ranges to the scenarios:
- [1, 25]
- [1, 30]
- [20, 80]
110
Roughly my feelings: https://elicit.ought.org/builder/trBX3uNCd

Reasoning: I think lots of people have updated too much on GPT-3, and that the current ML paradigms are still missing key insights into general intelligence. But I also think enough research is going into the field that it won't take too long to reach those insights.
60
To the extent that it differs from others' predictions, probably the most important factor is that I think even if AGI is hard, there are a number of ways in which human civilization could become capable of doing almost arbitrarily hard things, like through human intelligence enhancement or sufficiently transformative narrow AI. I think that means the question is less about how hard AGI is and more about general futurism than most people think. It's moderately hard for me to imagine how business as usual could go on for the rest of the century, but who knows.
*
60My snapshot: https://elicit.ought.org/builder/xPoVZh7Xq
Idk what we mean by "AGI", so I'm predicting when transformative AI will be developed instead. This is still a pretty fuzzy target: at what point do we say it's "transformative"? Does it have to be fully deployed and we already see the huge economic impact? Or is it just the point at which the model training is complete? I'm erring more on the side of "when the model training is complete", but also there may be lots of models contributing to TAI, in which case it's not clear which particular model we mean. Nonetheless, this feels a lot more concrete and specific than AGI.
Methodology: use a quantitative model, and then slightly change the prediction to account for important unmodeled factors. I expect to write about this model in a future newsletter.
Some updates:
- This should really be thought of as "when we see the transformative economic impact", I don't like the "when model training is complete" framing (for basically the reason mentioned above, that there may be lots of models).
- I've updated towards shorter timelines; my median is roughly 2045 with a similar shape of the distribution as above.
- One argument for shorter timelines than that in bio anchors is "bio anchors doesn't take into account how non-transformative AI would accelerate AI progress".
- Another relevant argument is "the huge difference between training time compute and inference time compute suggests that we'll find ways to get use out of lots of inferences with dumb models rather than a few inferences with smart models; this means we don't need models as smart as the human brain, thus lessening the needed compute at training time".
- I also feel more strongly about short horizon models probably being sufficient (whereas previously I mostly had a mixture between short and medium horizon models).
- Conversely, reflecting on regulation and robustness made me think I was underweighting those concerns, and lengthened my timelines.
*
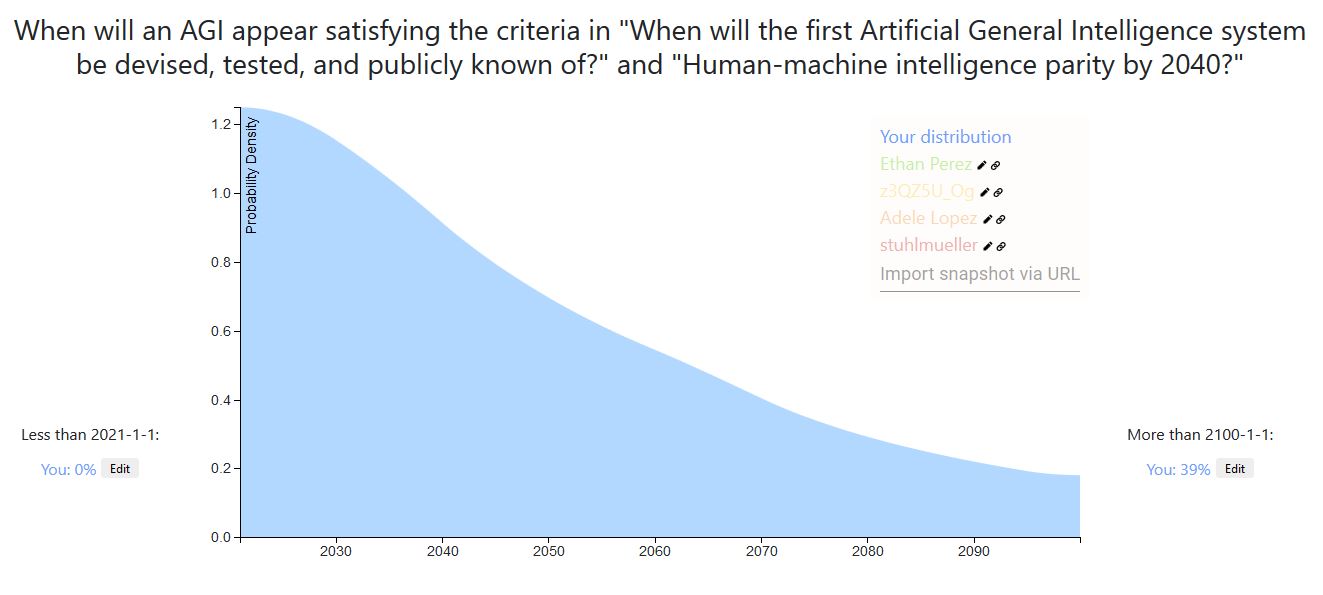
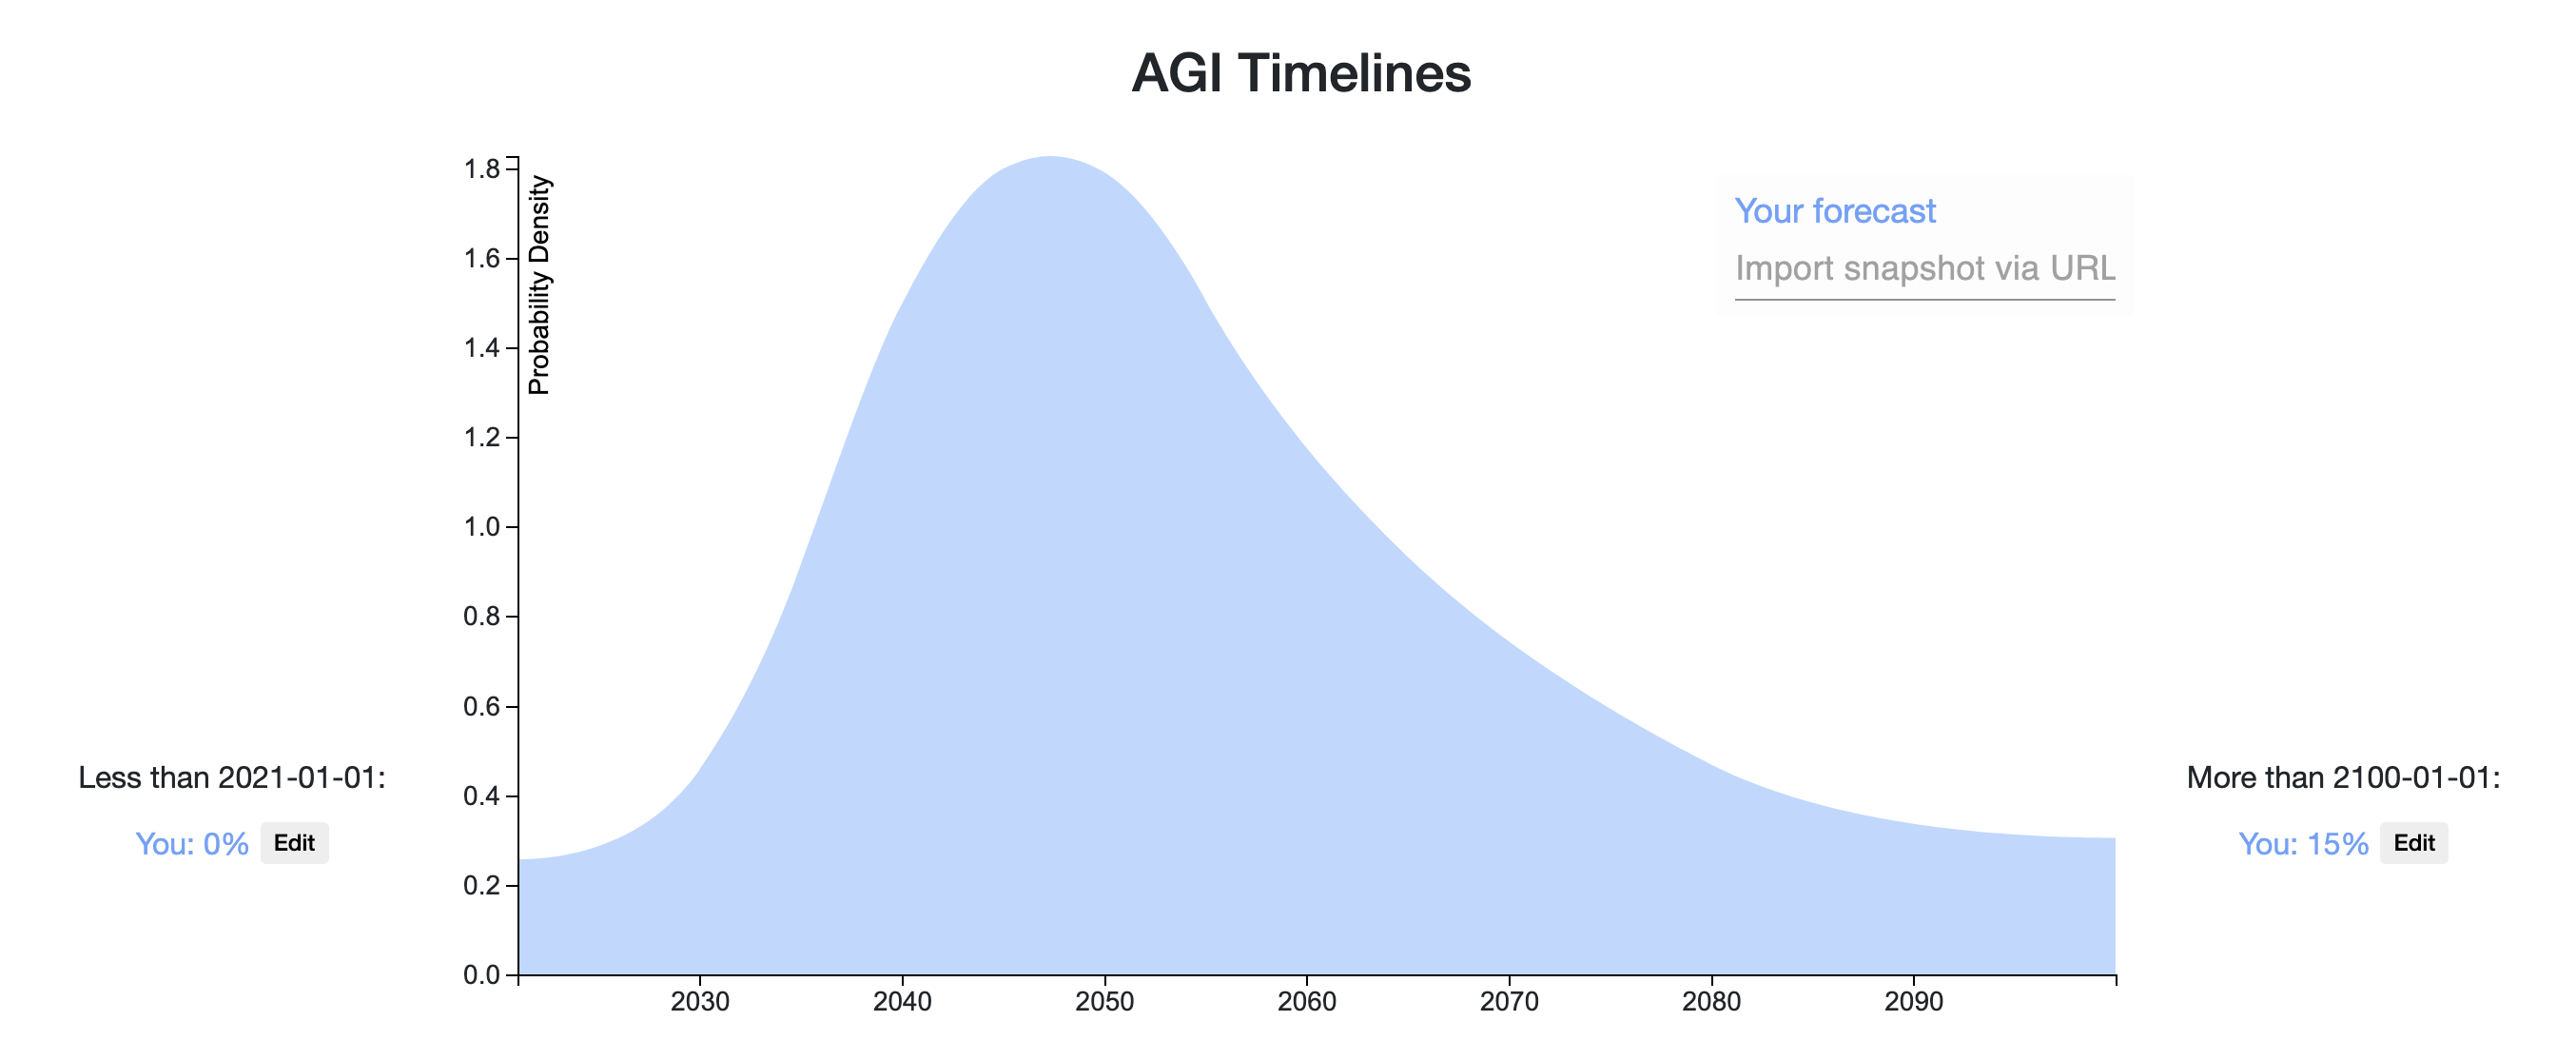
50If AGI is taken to mean, the first year that there is radical economic, technological, or scientific progress, then these are my AGI timelines.

My percentiles
- 5th: 2029-09-09
- 25th: 2049-01-17
- 50th: 2079-01-24
- 75th: above 2100-01-01
- 95th: above 2100-01-01
I have a bit lower probability for near-term AGI than many people here are. I model my biggest disagreement as about how much work is required to move from high-cost impressive demos to real economic performance. I also have an intuition that it is really hard to automate everything and progress will be bottlenecked by the tasks that are essential but very hard to automate.
Some updates:
- I now have an operationalization of AGI I feel happy about, and I think it's roughly just as difficult as creating transformative AI (though perhaps still slightly easier).
- I have less probability now on very long timelines (>80 years). Previously I had 39% credence on AGI arriving after 2100, but I now only have about 25% credence.
- I also have a bit more credence on short timelines, mostly because I think the potential for massive investment is real, and it doesn't seem implausible that we could spend >1% of our GDP on AI development at s
40
Here is a link to my forecast
And here are the rough justifications for this distribution:
I don't have much else to add beyond what others have posted, though it's in part influenced by an AIRCS event I attended in the past. Though I do remember being laughed at for suggesting GPT-2 represented a very big advance toward AGI.
I've also never really understood the resistance to why current models of AI are incapable of AGI. Sure, we don't have AGI with current models, but how do we know it isn't a question of scale? Our brains are quite efficient, but the total energy consumption is comparable to that of a light bulb. I find it very hard to believe that a server farm in an Amazon, Microsoft, or Google Datacenter would be incapable of running the final AGI algorithm. And for all the talk of the complexity in the brain, each neuron is agonizingly slow (200-300Hz).
That's also to say nothing of the fact that the vast majority of brain matter is devoted to sensory processing. Advances in autonomous vehicles are already proving that isn't an insurmountable challenge.
Current AI models are performing very well at pattern recognition. Isn't that most of what our brains do anyway?
Self attended recurrent transformer networks with some improvements to memory (attention context) access and recall to me look very similar to our own brain. What am I missing?
...I've also never really understood the resistance to why current models of AI are incapable of AGI. Sure, we don't have AGI with current models, but how do we know it isn't a question of scale? Our brains are quite efficient, but the total energy consumption is comparable to that of a light bulb. I find it very hard to believe that a server farm in an Amazon, Microsoft, or Google Datacenter would be incapable of running the final AGI algorithm. And for all the talk of the complexity in the brain, each neuron is agonizingly slow (200-
This is a thread for displaying your timeline until human-level AGI.
Every answer to this post should be a forecast. In this case, a forecast showing your AI timeline.
For example, here are Alex Irpan’s AGI timelines.
For extra credit, you can:
How to make a distribution using Elicit
How to overlay distributions on the same graph
How to add an image to your comment
If you have any bugs or technical issues, reply to Ben (here) in the comment section.
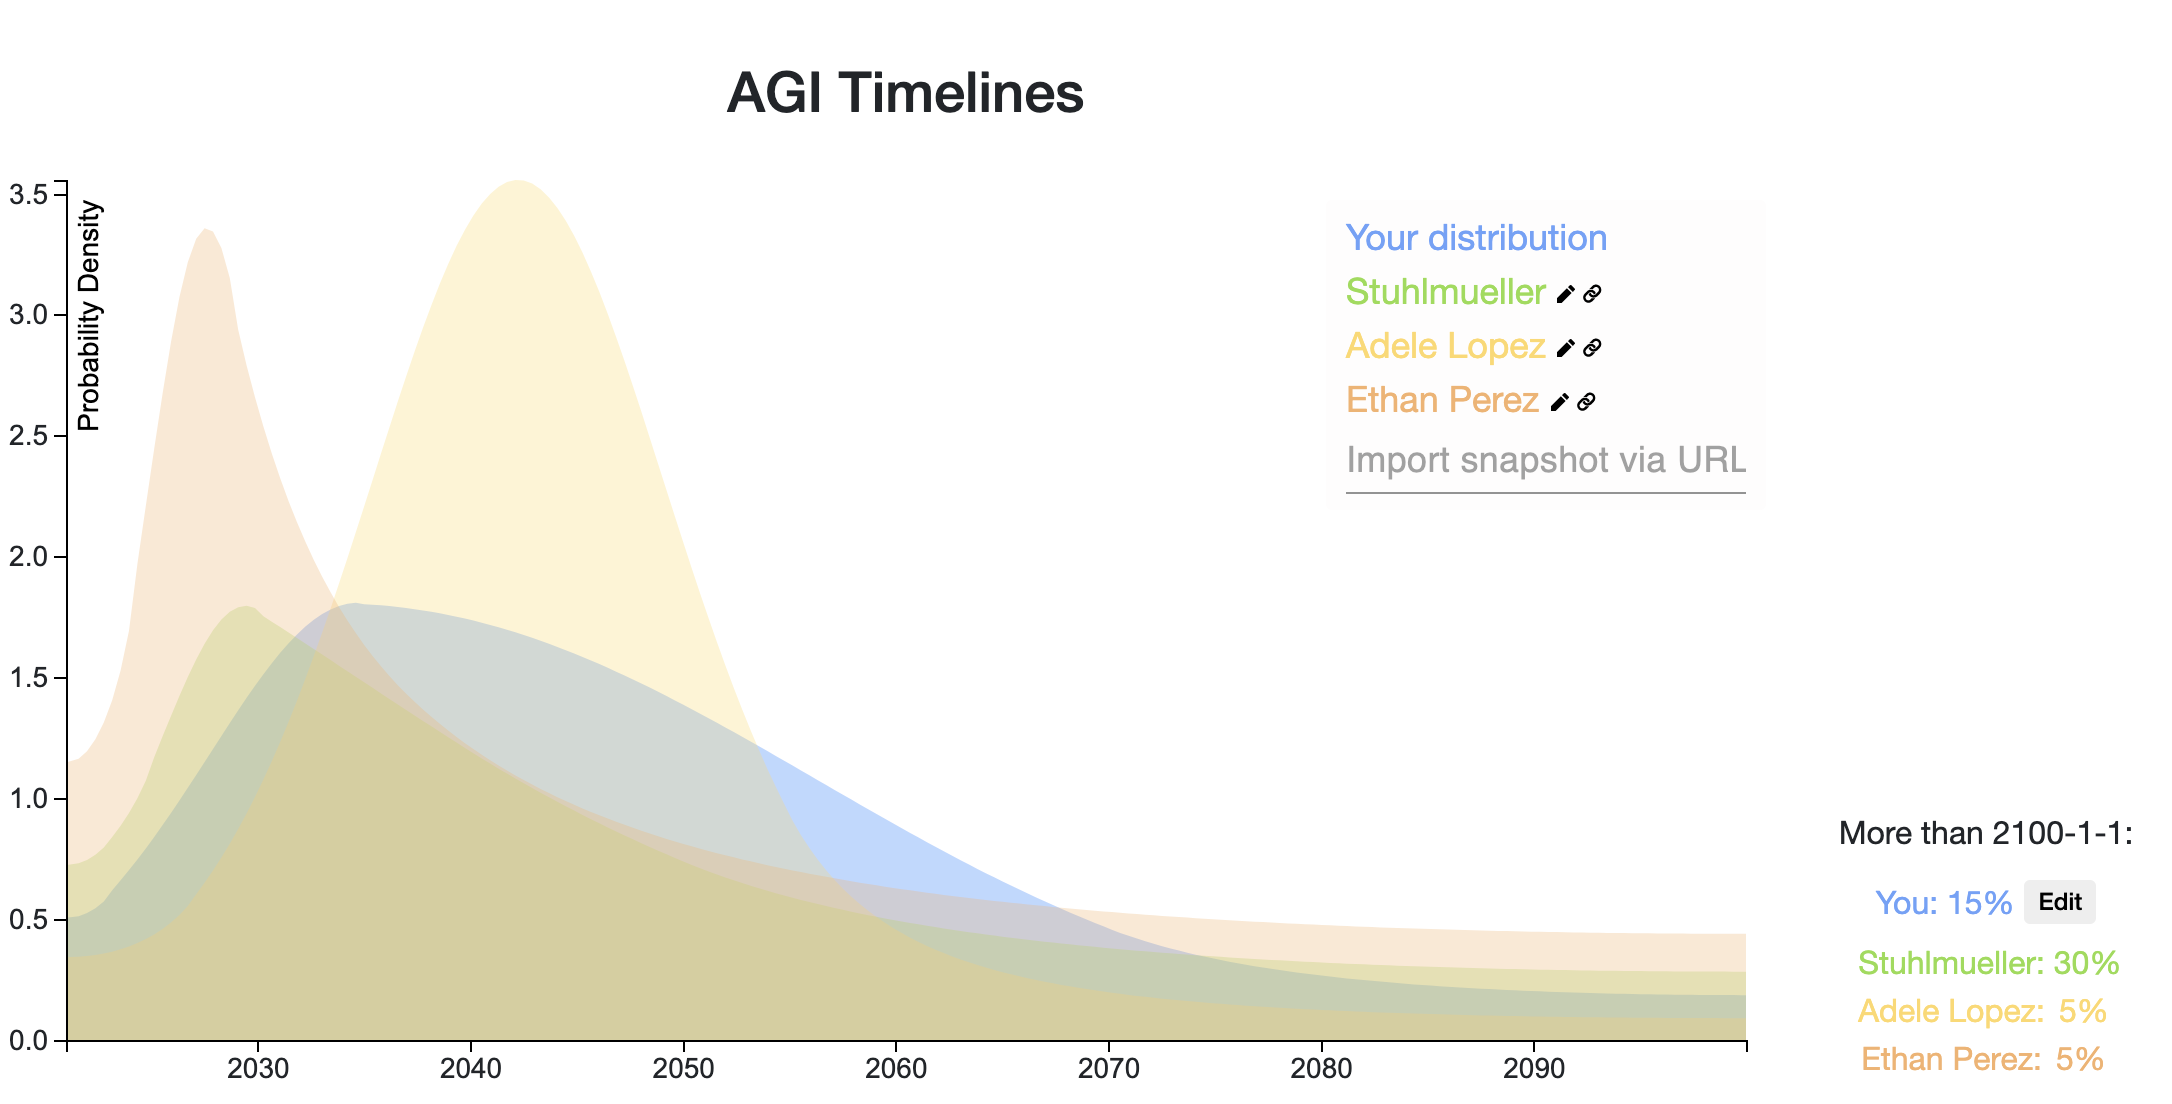
Top Forecast Comparisons
Here is a snapshot of the top voted forecasts from this thread, last updated 9/01/20. You can click the dropdown box near the bottom right of the graph to see the bins for each prediction.
Here is a comparison of the forecasts as a CDF:
Here is a mixture of the distributions on this thread, weighted by normalized votes (last updated 9/01/20). The median is June 20, 2047. You can click the Interpret tab on the snapshot to see more percentiles.